National data on working from home glosses over some important geographic differences that are key to understanding the demand for commercial real estate. Workers in the Sun Belt area of the country are more likely to go to their workplaces, including offices, while workers in gateway metros are less likely. While there are many drivers of work from home, one reason for the differences across locations is commute times. Analysis shows in those areas with longer commutes, workers are more likely to work from home.
According to data from Google on all workers and Kastle on office workers, workers in gateway cities are more likely to work from home. Charts 1 and 2 plot the average weekly percent of visits to the workplace generally (Chart 1) and the office specifically (Chart 2) for major metro areas the week of May 16, 2022. Chart 1 has additional metros not covered by Kastle.
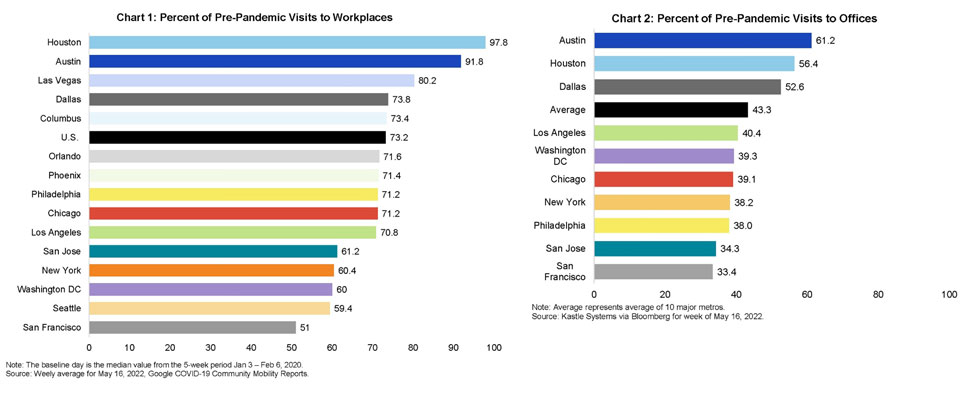
The trends are similar for both charts:
- Houston and Austin residents were most likely to go to work and the office with residents of San Jose and San Francisco least likely to go to the office.
- Austin residents were at 61.2% of their pandemic baseline of office visits, and overall, the metro was at 97.8% of the pandemic baseline for all workers.
- San Francisco was just over half of its pre-pandemic baseline for return to workplaces with offices 31.6% occupied.
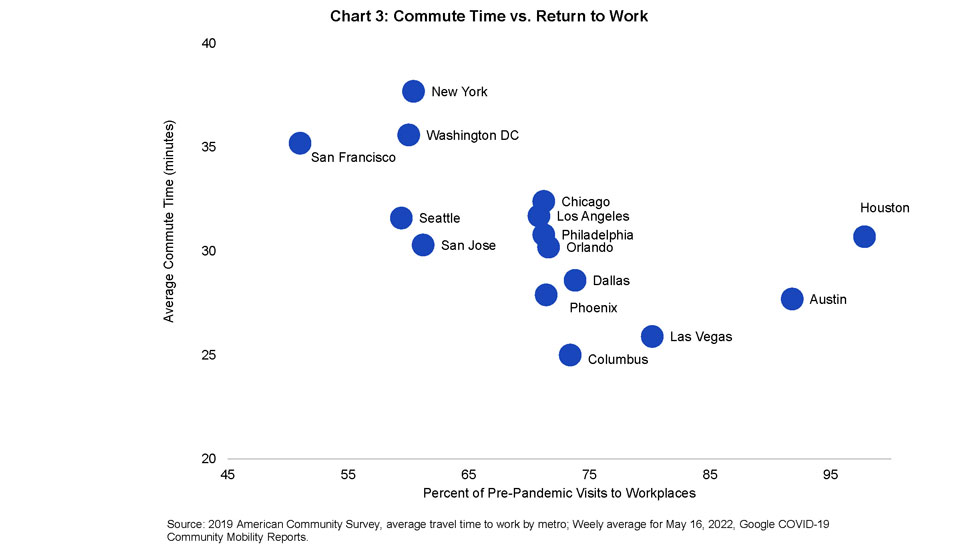
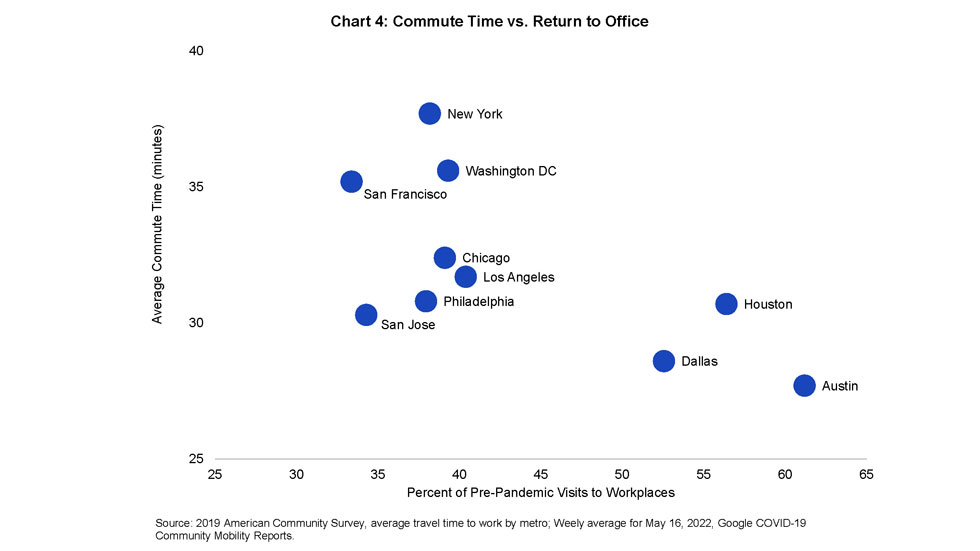
Among the reasons why work from home is more popular in particular parts of the country is commute time. Those who work from home get more time back in their day and have a larger reduction in stress when their commutes are longer. Charts 3 and 4 illustrate this correlation between going to work and commute times, as measured by the Census Bureau’s American Community Survey. Chart 3 looks at the expanded list of metros from Chart 1, while Chart 4 looks at Kastle’s ten metro areas. In both charts, cities with lower commute times tend to have a higher percentage of time back at workplaces, including offices.
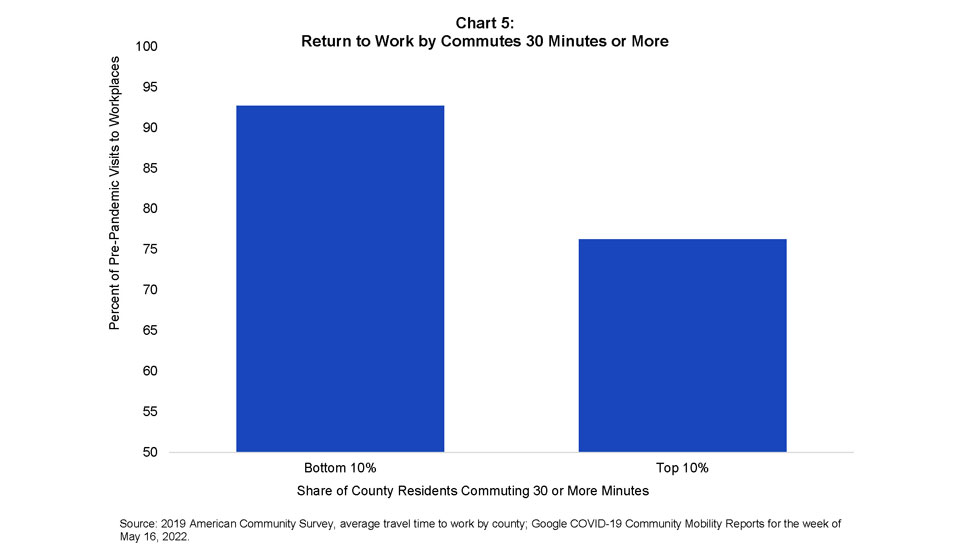
Looking at the country as a whole, the American Community Survey calculates the share of commuters with different commute times in each county in the U.S. Counties at the top of the distribution, with a much higher share of residents with a commute of 30 minutes or longer, visit workplaces at 76% of their pre-pandemic norm compared to residents in counties with the lowest share of residents who visit at 93% of their pre-pandemic norm.
More Nareit coverage on work from home: