In the second quarter of 2026, CoStar data indicated that fundamentals across the four traditional property types continued to show positive momentum and signs of stabilization. However, occupancy rates were generally flat and rent growth rates struggled to keep pace with inflation. The property market appears to be at an inflection point and the strength of each sector’s future operational gains will likely be shaped by its ability to make continued improvements to its supply and demand dynamics.
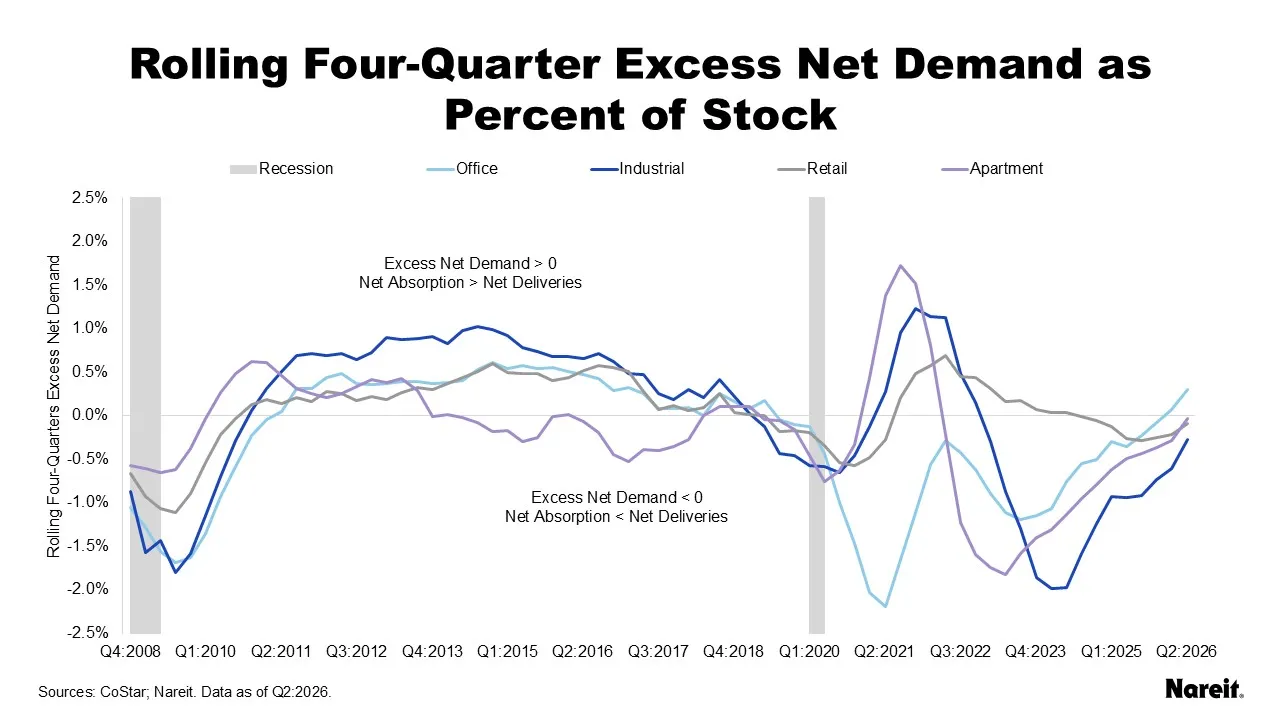
The chart above presents rolling four-quarter excess net demand as a percentage of existing stock by property type from the fourth quarter of 2008 to the second quarter of 2026; it also displays U.S. recessions. Excess net demand was calculated as net absorption (demand) less net deliveries (supply) for each property type.
Each sector has maintained an upward trajectory in its excess net demand measure, signaling continued improvement in its supply and demand fundamentals. After 26 consecutive quarters of negative excess net demand, the office sector breached into positive territory at the start of this year and gained further momentum in the second quarter of 2026. Notably, office was the only traditional property type where demand exceeded supply. For the other sectors, net absorption remained below net deliveries, though apartments and retail were effectively at equilibrium and industrial continued to move closer to balance.
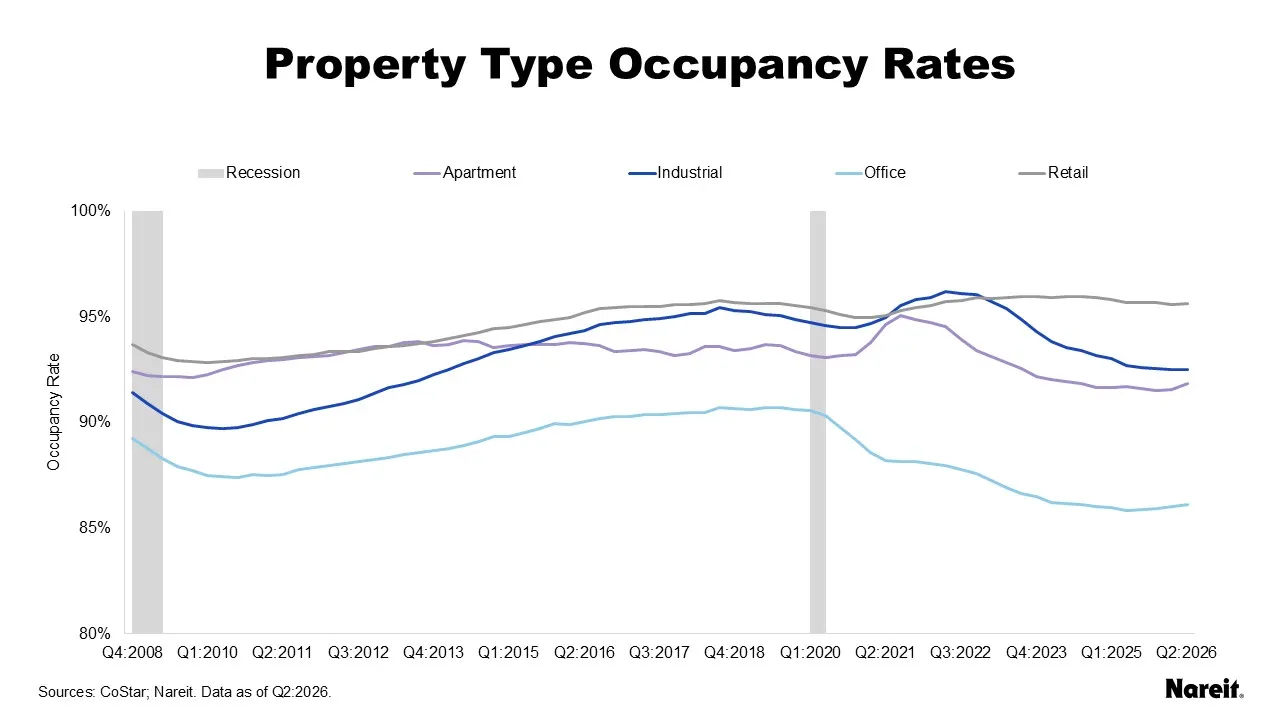
The chart above shows occupancy rates for the four traditional property types, as well as U.S. recessions, from the fourth quarter of 2008 to the second quarter of 2026.
Retail occupancy has remained high and stable for the past few years; it was 95.6% in the second quarter of 2026. Industrial, apartment, and office occupancy rates have been trending downward, but have shown recent signs of stabilization. As of the second quarter of 2026, occupancy rates for industrial, apartments, and office stood at 92.5%, 91.9%, and 86.1%, respectively. Office and apartment occupancy rates remained near their respective post-2008 lows.
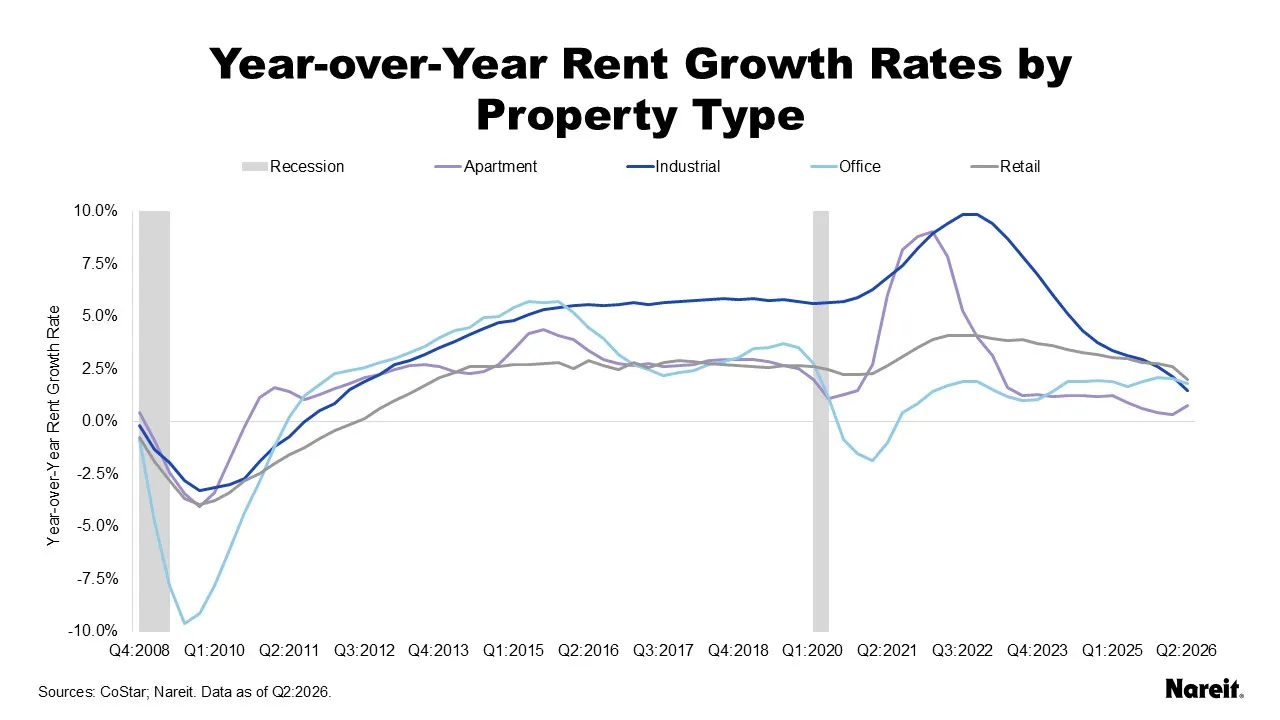
The chart above displays year-over-year rent growth rates by property type from the fourth quarter of 2008 to the second quarter of 2026, including U.S. recessions.
Rental growth rates have generally slowed, but remained positive across the four traditional property types. Unfortunately, rents have recently struggled to keep pace with inflation. In the second quarter of 2026, rent growth rates were 2.0% for retail, 1.8% for office, 1.5% for industrial, and 0.8% for apartments.
CoStar data show that supply and demand fundamentals have continued to strengthen across the four traditional property types. Yet, occupancy rates were largely flat and rent growth rates stayed positive but modest. Future property operational gains will likely depend on further improvements of supply-demand dynamics.