The price-to-earnings ratio (P/E) is a useful tool for gauging stock valuations, as it reflects an implicit forecast of future earnings growth. Stocks or industries with higher price multiples are expected to have faster earnings growth than those with lower price multiples. While higher P/E ratios may correctly signal rapid earnings growth, they can also be a warning sign of speculative prices or those based on unrealistic expectations. Stocks or sectors with high P/E could be at risk of price declines if the original growth expectations are not met.
The price-to-FFO ratio is a comparable measure for REITs. A comparison of recent trends of the P/E ratio for the S&P 500 to the price-to-FFO ratio for REITs shows a contrasting risk/reward tradeoff between the broad equity market and REITs.
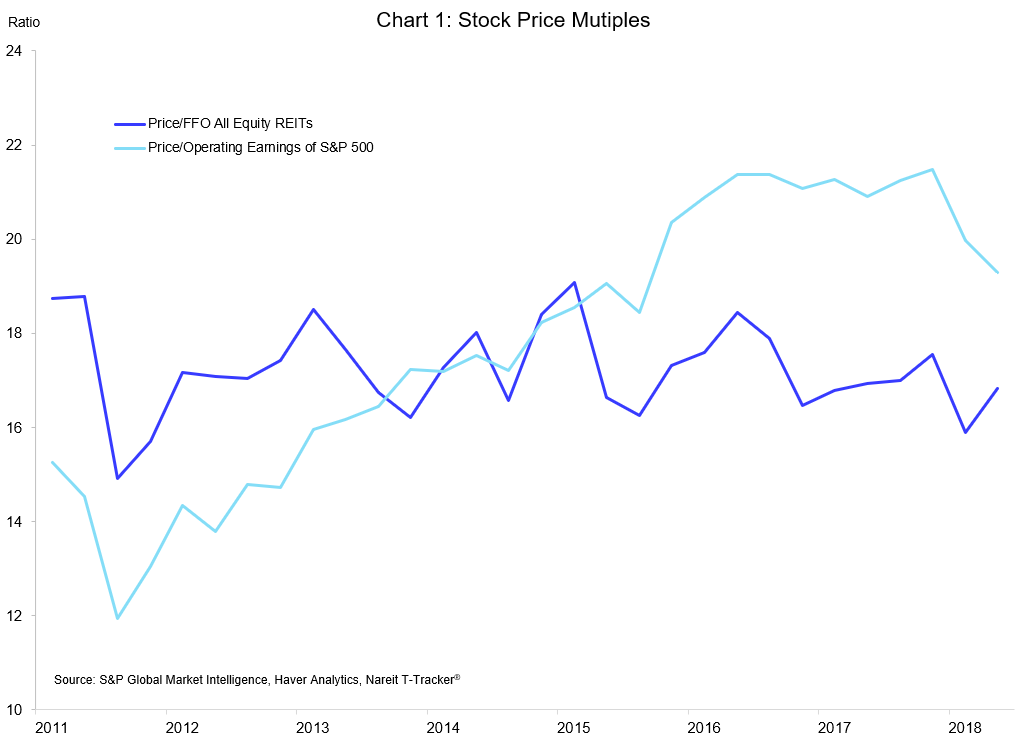
The P/E ratio on the S&P 500 moved steadily higher from 2011 to 2017, as stock price gains outpaced earnings growth. Indeed, the price multiple nearly doubled over this period, although it has declined in the first half of 2018 due to robust earnings growth. The price multiple is still elevated, however, and its rise since 2011 has led to worries that prices may be too frothy and possibly based on unrealistic expectations that recent trends in earnings growth will continue.
The price multiple for REITs, in contrast, has shown no such increase, and indeed the readings in 2018 are a tad below the average over the prior six years. REIT valuations have remained conservative, even as FFO has risen steadily (for data on REIT FFO, as well as the P/FFO ratio and other measures of operating performance, see the Nareit T-Tracker® ). In terms of the risk-reward tradeoff, REITs have perhaps greater upside potential than the S&P 500, should FFO growth continue recent trends, and may not carry the same risks of a potential price decline should earnings growth slow.
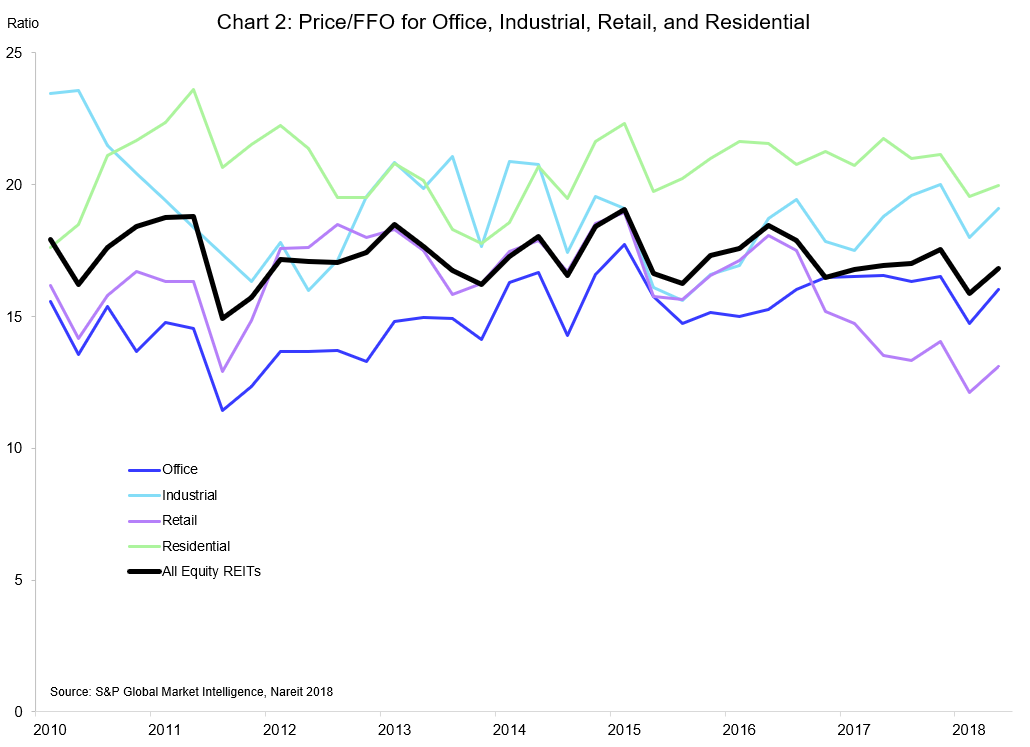
The price-to-FFO ratio can also tell us about market expectations for earnings growth for different property sectors.[i] Chart 2 plots the price multiples for the Office, Industrial, Retail and Residential REIT sectors, which together account for nearly half the current market capitalization of all Equity REITs. The price/FFO multiples on the residential and industrial sectors are above the average for all Equity REITs. This is consistent with expectations that strong demand for rental housing—think “renter nation”—will continue to support rents and earnings growth in the residential sector. Similarly, the rise of e-commerce increased demand for industrial space, including logistics facilities, boosting the sector’s price-to-FFO. The price multiple for Office REITs is similar to the overall REIT average, while that of Retail REITs is lower, reflecting expectations of subdued earnings growth.
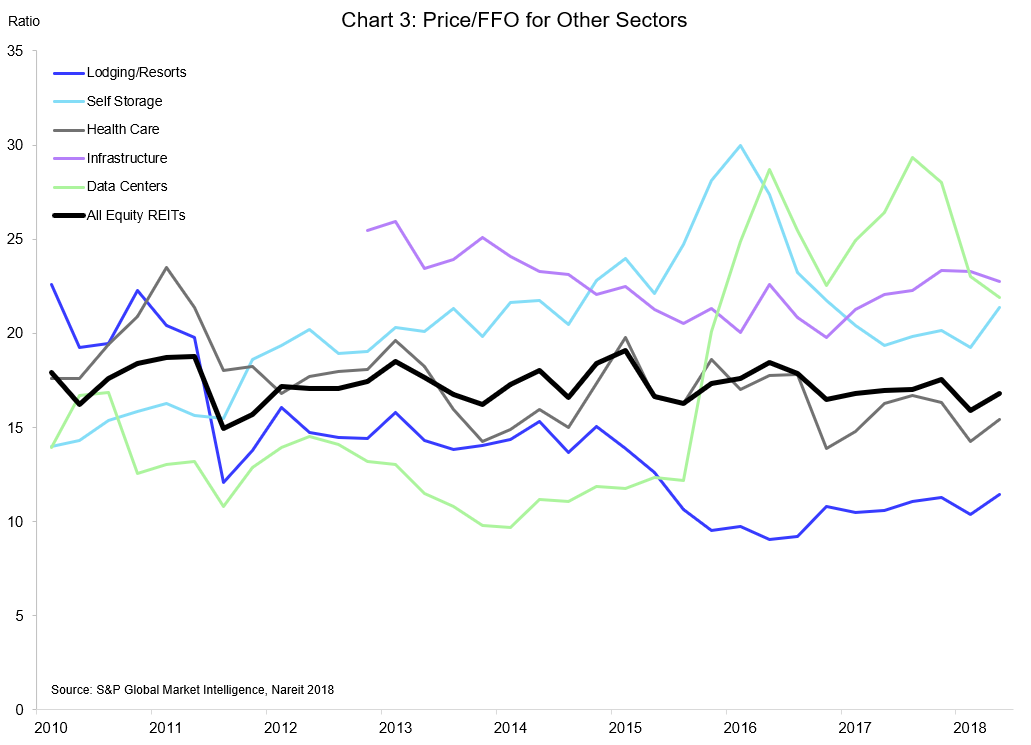
Chart 3 shows the price/FFO multiples for several other property sectors. It is worth highlighting a few sectors with higher price multiples, as there are good reasons to believe these sectors may continue to enjoy strong earnings growth. For example, Infrastructure and Data centers help transmit and store the message traffic for cellular communications and the internet. Given the sustained growth of both voice and data messages, it is not unreasonable to expect rapid earnings growth to continue in the future. The price multiple on the Self Storage sector is not far behind, as tight housing markets across the country mean that many households need a place to store their excess belongings.
Stock price multiples are useful in the study of stock valuations due to their implicit forecast of future earnings growth. While valuations on the S&P 500 have outpaced the growth of earnings, and possibly pose risk of a correction, valuations in the REIT sector have been well-supported by FFO growth. Among the property sectors, the new price multiple estimates presented here show that the sectors with higher price multiples are those that may well experience higher rates of FFO growth ahead. For REITs overall as well as the property sectors, there are few signs of overvaluation in terms of elevated price multiples.
[i] The aggregate P/FFO ratio for all REITs is included in the T-Tracker data release, while these property sector-level data are currently unpublished series being developed for research purposes.