New supplemental tables from the NAREIT T-Tracker® series shed further light on the commercial real estate markets and listed equity REITs. These tables provide a recent snapshot as well as a longer history, for context, for price to FFO multiples; occupancy rates of REIT-owned properties; and gross acquisitions, dispositions and net acquisitions of properties by REITs:
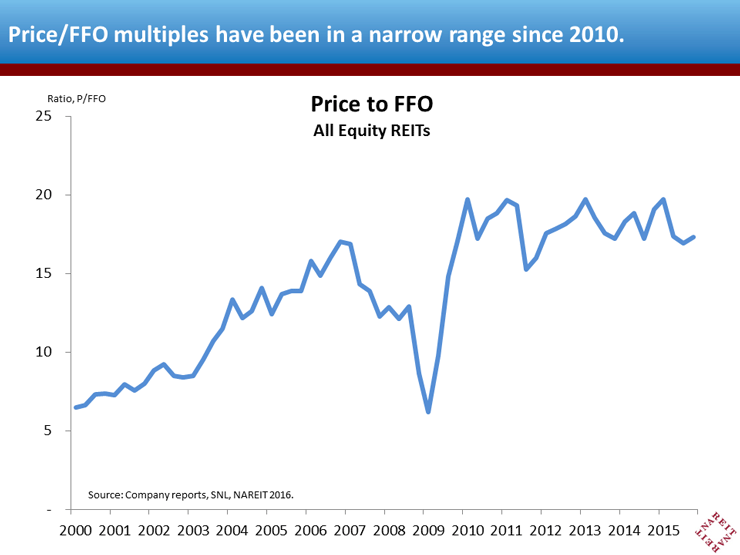
Price to FFO multiple. Price to FFO has been in a steady range since 2010, of between 15x and 20x. It is noteworthy that the solid price gains that REITs experienced in 2014 were matched by rising FFO, leaving price multiples little changed. Share price declines since early 2015 have left the P/FFO multiple at the low end of its recent range;
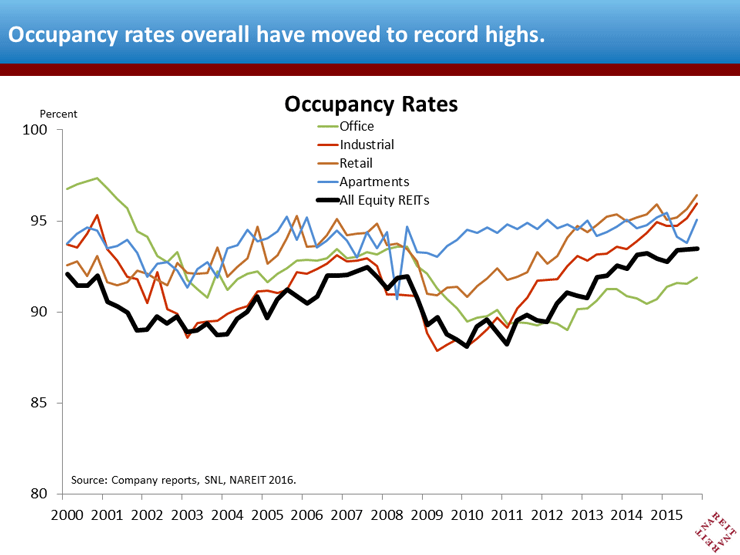
Occupancy rates. This is simply the flip side of vacancy rates. Occupancy has moved to a record high for the equity REIT sector as a whole (below chart, black line), led by increases in regional malls (in the retail sector) and industrial. Apartment occupancy rates declined in Spring/Summer 2015 as new construction began to hit the market. Solid demand in the fourth quarter, however, lifted rates back towards the peak reached early last year. High occupancy rates across property types are likely to support rent growth and property valuations in 2016;
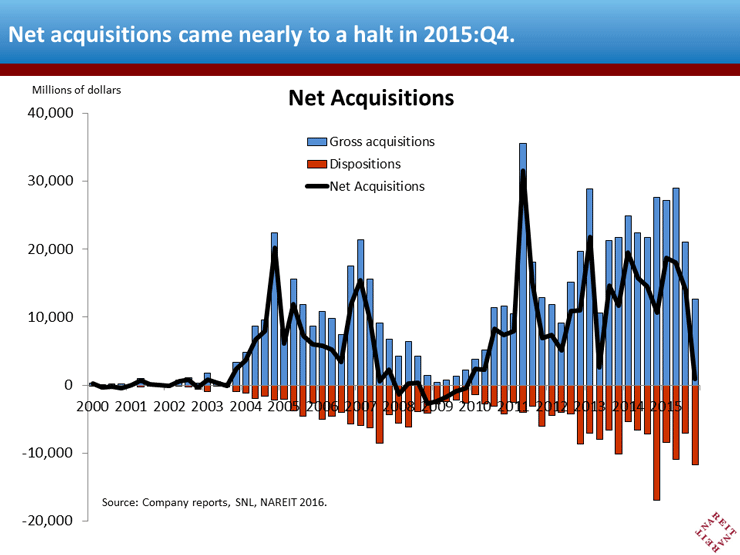
Net acquisitions. Sales of properties increased in 2015:Q4 (red bars in chart below), while purchases slowed considerably more (blue bars), leaving net acquisitions roughly flat (black line). The net figures are the balance of offsetting trends across sectors, with Data Centers, Health Care and Self Storage making significant purchases, while Office and Lodging/Resorts registered sales of properties.
Visit the T-Tracker page to download all charts and data. [Note: these supplemental tables include new data that were not included in the original T-Tracker release.]