Space market fundamentals can differ markedly across property types. Net absorption (demand) and net deliveries (supply) for the four traditional property types (retail, apartments, industrial, and office) highlight the ups and downs of the space markets and can illustrate excess net demand (net absorption less net deliveries) for each sector.
Recent data from CoStar showcase the supply and demand differences across property types. In the fourth quarter of 2025, office and retail were the sectors where demand exceeded supply. For industrial and apartments, net absorption continued to fall short of net deliveries. Signs of stabilization, however, were evident across each of the four traditional property types.
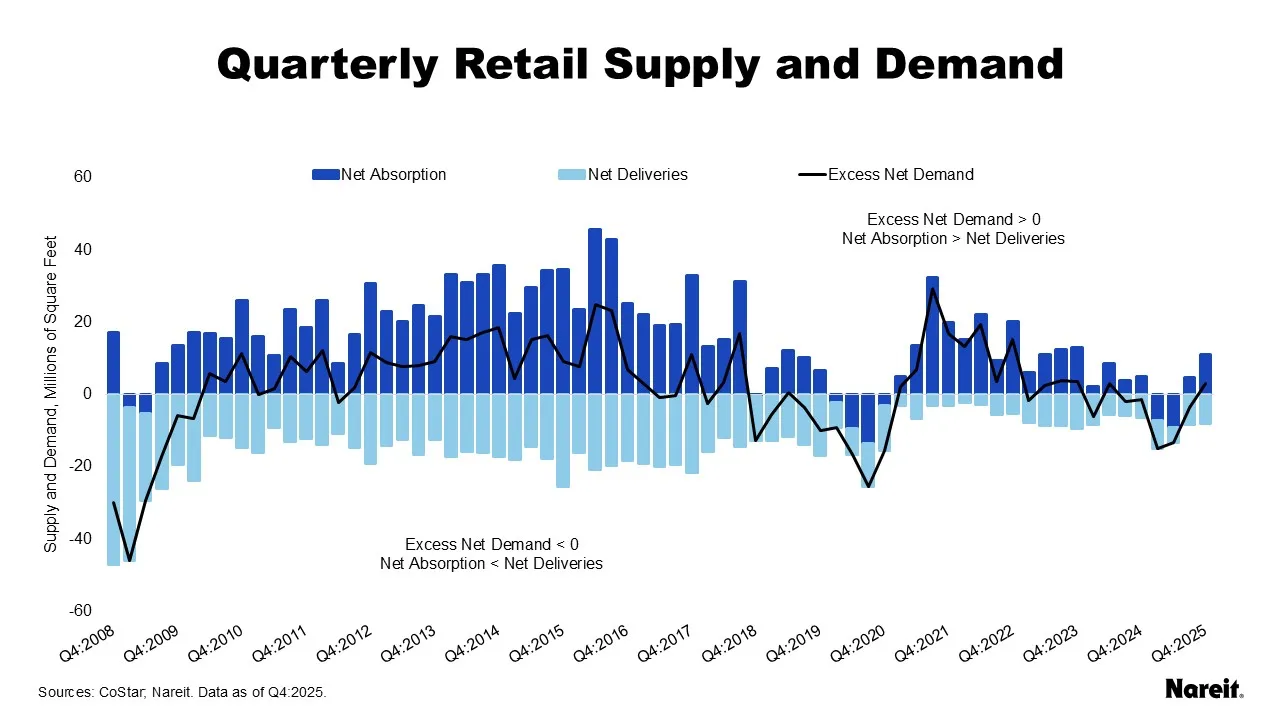
The chart above displays quarterly retail net absorption and net deliveries in millions of square feet, as well as excess net demand from the fourth quarter of 2008 to the fourth quarter of 2025. While both net absorption and net deliveries are typically positive numbers, in the chart, net absorption and net deliveries are indicated as positive and negative values, respectively.
Since 2023, retail supply and demand metrics have generally maintained a slight imbalance. Quarterly net deliveries modestly outpaced net absorption for five consecutive quarters, but excess net demand breached into positive territory in the last quarter of 2025 due to tighter supply and stronger demand. The sector’s ability to exercise discipline over its supply pipeline has benefited its space market fundamentals. In the fourth quarter of 2025, retail occupancy and rental growth rates were 95.7% and 2.1%, respectively.
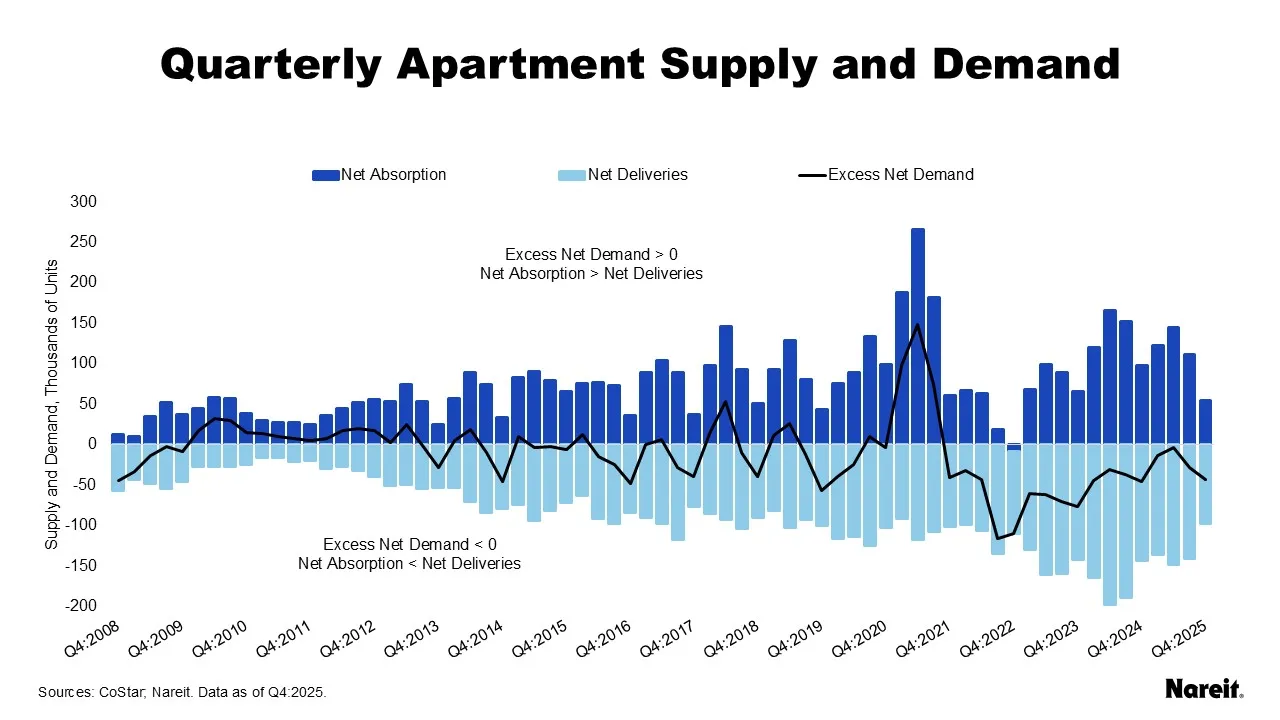
The chart above presents quarterly apartment net absorption and net deliveries, as well as excess net demand from the fourth quarter of 2008 to the fourth quarter of 2025. Apartment supply has now exceeded demand for 17 consecutive quarters. This has taken a toll on the sector’s occupancy and rental growth rates. As of the fourth quarter of 2025, apartment occupancy averaged 91.5%; its lowest level since 2000. Year-over-year rent growth struggled to remain positive at 0.4%. Although the demand and supply imbalance for apartments was widest among the four traditional property types, it appears that the sector is seeking a bottom and making strides toward reaching equilibrium.
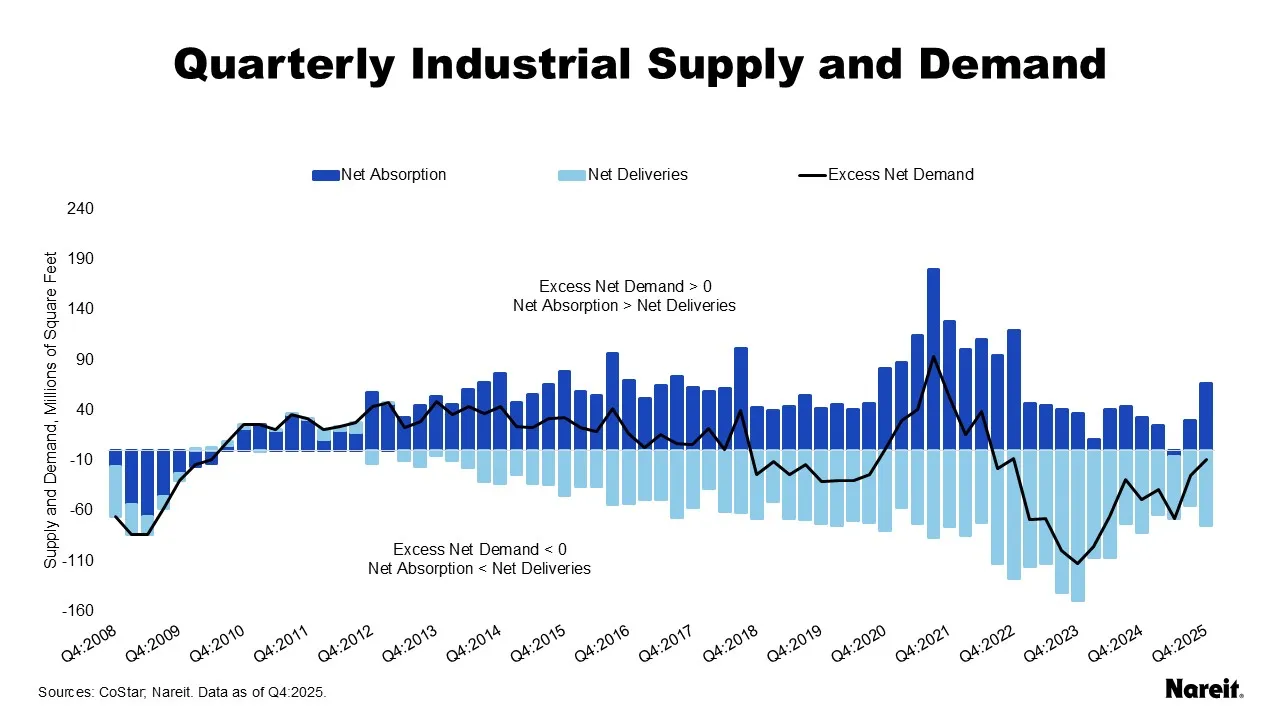
The chart above shows quarterly industrial net absorption and net deliveries, as well as excess net demand from the fourth quarter of 2008 to the fourth quarter of 2025. For more than a decade, the industrial sector enjoyed strong demand matched by significant supply responses. At the end of 2021, net absorption started its decline. Net deliveries, however, generally continued to grow through the end of 2023. As of the fourth quarter of 2025, industrial supply had bested demand for 14 quarters in a row, resulting in an occupancy rate of 92.6% and rent growth rate of 1.7%. Recent rising demand and reduced new supply have allowed progress to be made in restoring balance in fundamentals.
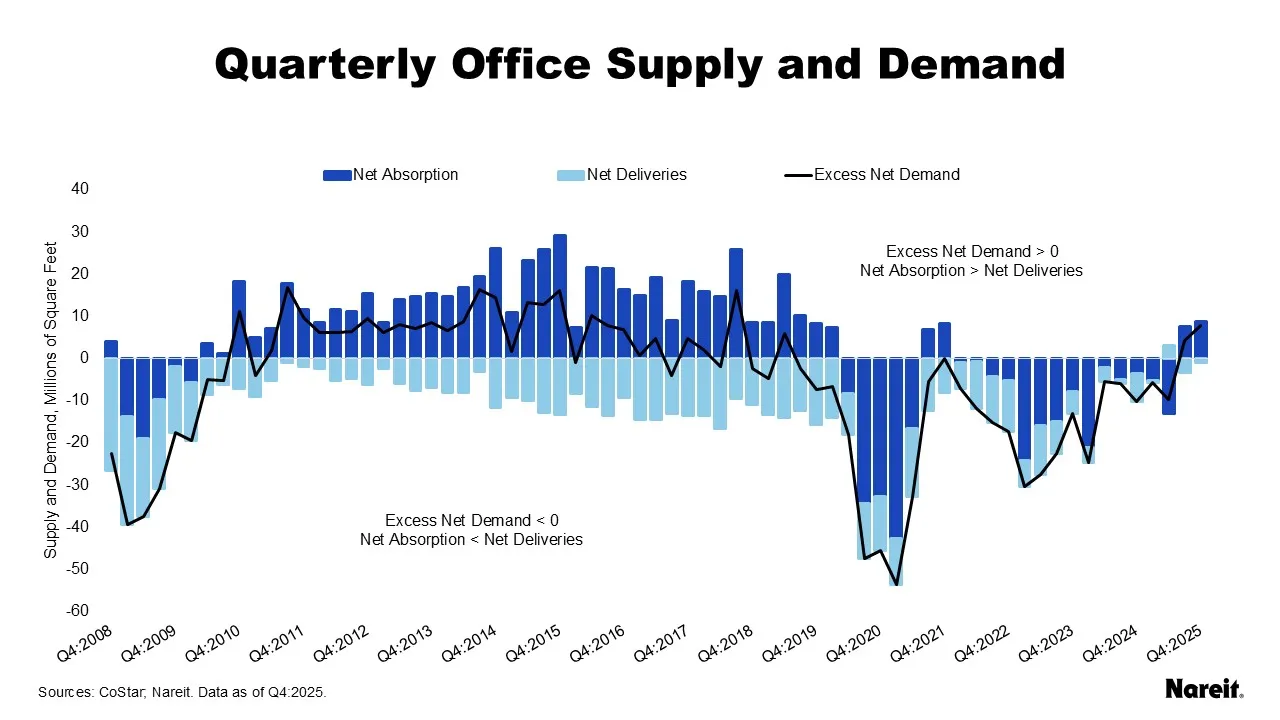
The chart above depicts quarterly office net absorption and net deliveries, as well as excess net demand from the fourth quarter of 2008 to the fourth quarter of 2025. While office demand challenges are well known, the property type has also suffered from supply issues. Years of negative net absorption have not restrained office net deliveries. While negative excess net demand has generally persisted since 2019, the sector saw positive excess net demand in the latter half of 2025. With restrained development and increased demand, office fundamentals have shown signs of stabilizing. Posting its second quarterly uptick, the occupancy rate was 86.0% in the last quarter of 2025 and the year-over-year rental gain was 1.2%.
Recent data from CoStar showcase the supply and demand differences across property types. Each sector’s story is nuanced. Each property type’s ability to maintain or make continued progress in moving toward its equilibrium will likely determine the strength of its property operational gains in 2026.