In the third quarter, the U.S. 10-year Treasury yield increased by 85 basis points, breaching 5% in early September for the first time since July 2007. Although higher interest rates may stir feelings of uneasiness among some real estate investors, they do not necessarily signal heightened volatility or uncertainty. For example, in the broader financial environment, recent equity and bond market ‘fear’ measures remain within normal ranges, showing no signs of turbulence, crisis, or panic. Amid elevated interest rates, typical market volatility, and divergent public-private real estate values, REITs continue to adapt quickly, respond rationally, and remain well positioned to thrive.
The Cboe Volatility Index (VIX Index), often referred to as the “fear” index, is a gauge of investor sentiment and market uncertainty. It measures expectations of near-term volatility of the broad U.S. stock market based on S&P 500 Index option prices. In periods of market stress, the level of the VIX tends to be high. In periods of complacency, it tends to be low.
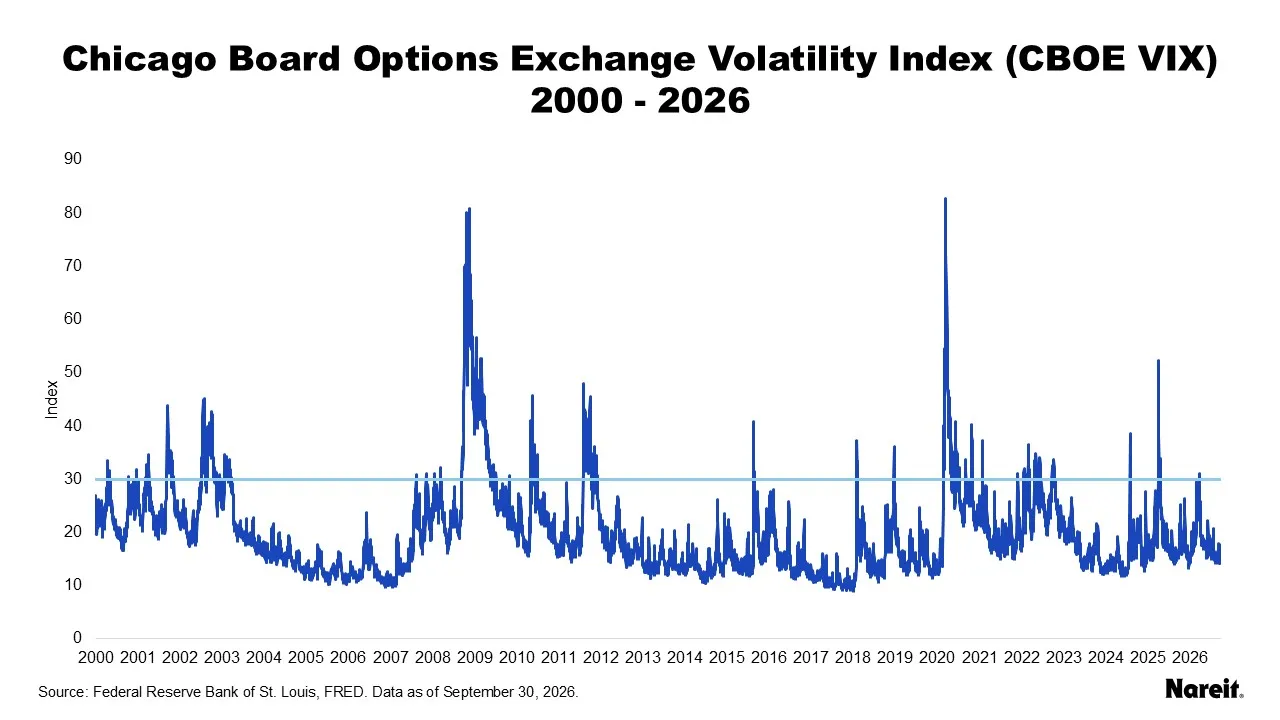
The chart above displays the VIX Index on a daily basis from 2000 through the end of September. It also includes a light blue horizontal line at a VIX level of 30 that represents a commonly-accepted threshold where extreme market turbulence, as well as elevated investor stress and anxiety, may be observed.
While there are no official definitions related to VIX levels, S&P Global interprets them in the following manner:
- Low (0 – 15): Typically indicates market optimism,
- Moderate (>15 – 20): Typically indicates a normal market,
- Medium (>20 – 25): Typically indicates growing market concern,
- High (>25 – 30): Typically indicates market turbulence, and
- Extremely High (>30): Typically indicates extreme market turbulence.
The VIX reached its highest level, 82.7, in March 2020 during the COVID-19 pandemic. It surged to 80.9 in November 2008 during the global financial crisis. More recently, it spiked to 52.3 in April 2025 with the introduction of new U.S. tariff policies. Since 2000, it has averaged 19.8. At the end of September, it stood at 16.3, reflecting an optimistic/normal market.
Often called the “VIX for bonds,” the ICE BofA U.S. Bond Market Option Volatility Estimate Index (MOVE Index) is an indicator of fixed-income market volatility. It tracks the implied volatility of U.S Treasury yields using a basket of one-month, over-the-counter options on two-, five-, 10-, and 30-year U.S. Treasuries. MOVE levels reflect market uncertainty regarding interest rates and the broader fixed income environment. At times, the MOVE Index has provided earlier indications of concern than the VIX Index, but they are not always in sync.
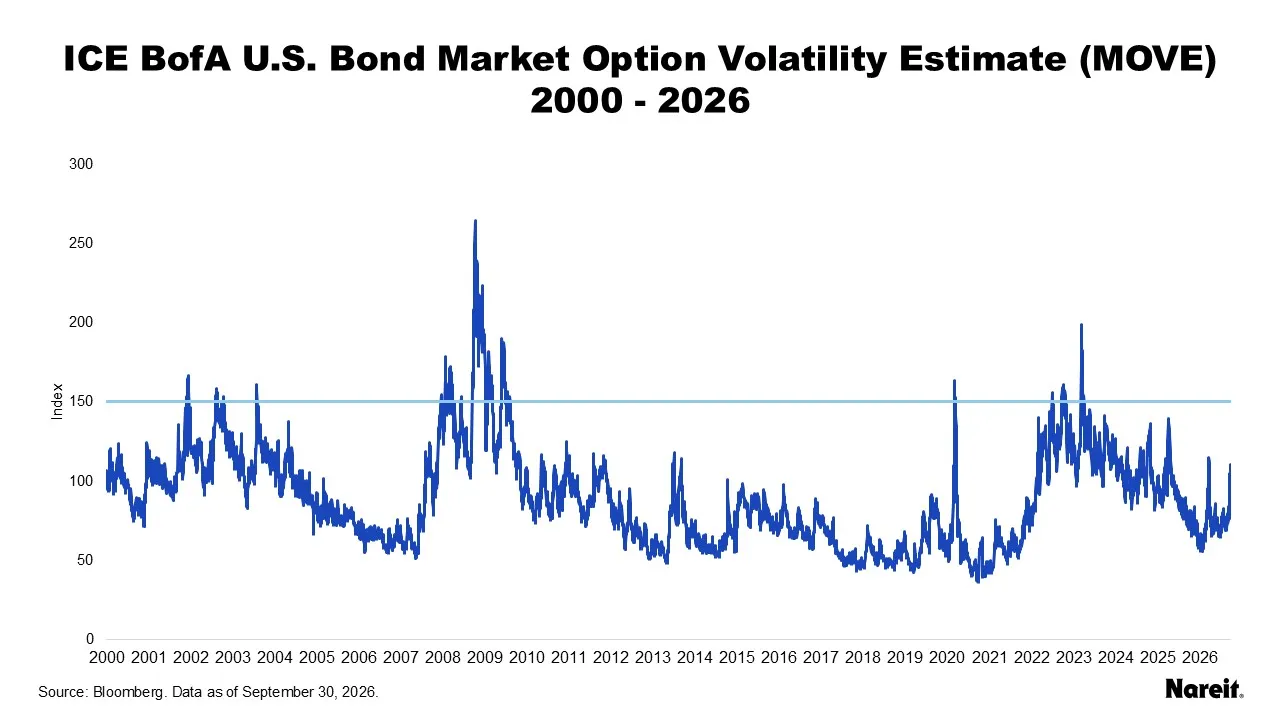
The chart above presents the daily MOVE Index from 2000 through this September. The light blue horizontal line marks 150, a recognized threshold for extreme market stress. In general, lower (higher) values indicate that the market expects smaller (larger) yield swings and it has more (less) confidence in the near-term path of interest rates.
The MOVE reached its highest level, 264.6, in October 2008 during the global financial crisis. It surged to 163.7 in March 2020 during the COVID-19 pandemic. More recently, it spiked to 198.7 in March 2023 due to the regional banking crisis. Since 2000, it has averaged 89.1. At the end of September, it stood at 110.5, a level that can be considered “typical/normal.”
REITs have adapted quickly to changing financial market conditions and continue to make disciplined capital market decisions. As interest and financing costs have recently risen, REITs have tempered their debt issuance activities. Although higher, REIT borrowing costs remain attractive relative to financing options available to most other real estate investors.
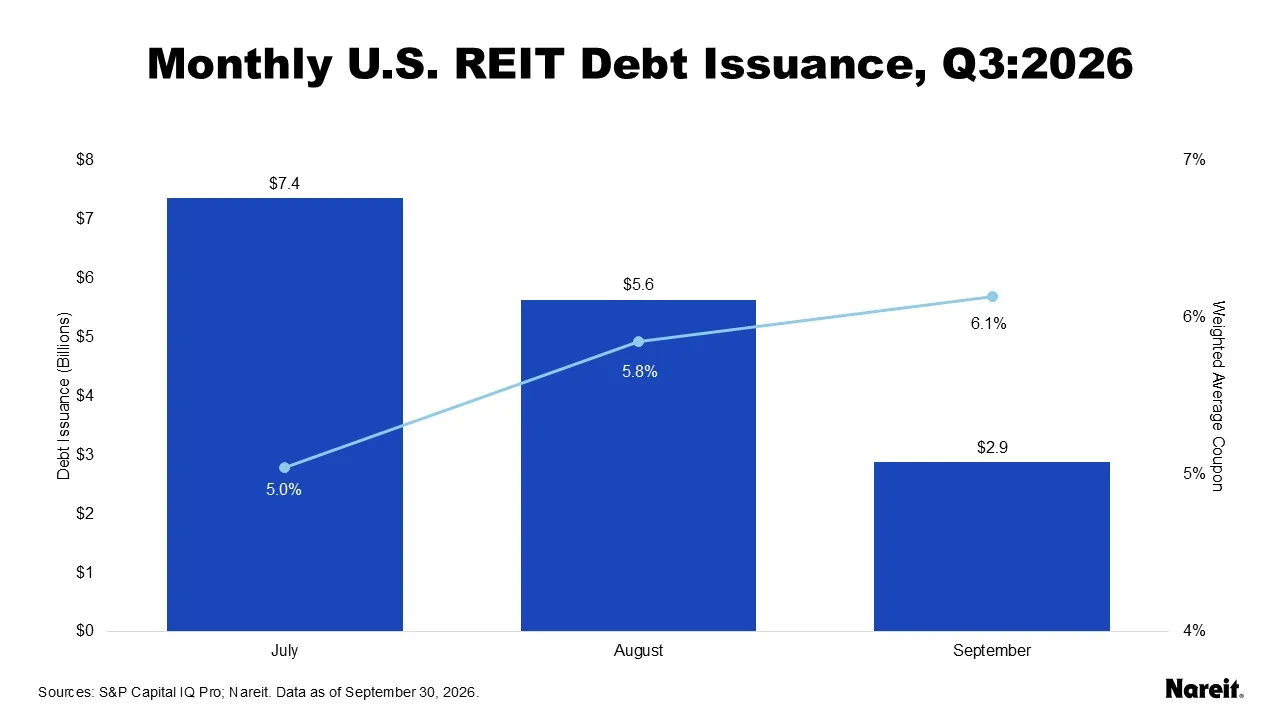
Over the last quarter, the 10-year Treasury yield soared 85 basis points. With the rise in interest rates, the chart above highlights the consecutive monthly declines in REIT debt issuances and increases in weighted average coupon rates in the third quarter of 2026. Note that debt coupon rates reflect the current interest rate environment and the credit quality of underlying issuances.
Specifically:
- In July, the 10-year Treasury yield rose 31 basis points to 4.75%. Over the month, REITs issued $7.4 billion of debt at a weighted average coupon rate of 5.0%.
- In August, the 10-year Treasury yield started and ended the month at 4.75%. REIT debt issuance fell by nearly 25% to $5.6 billion, while the weighted average coupon rate climbed to 5.8%.
- In September, the 10-year Treasury yield increased 54 basis points to 5.29%. REIT debt issuance dropped by nearly half from August to $2.9 billion. The weighted average coupon rate pushed higher to 6.1%.
Data show that REITs readily acclimated to the evolving financial market landscape and responded rationally to higher borrowing costs by moderating their debt market activity.
In today’s elevated interest rate environment, equity and bond market “fear” metrics remain within normal ranges, and public-private real estate values remain misaligned. REITs have adapted quickly, exhibited rational behavior in their capital market decisions, and remain well positioned to navigate these market conditions and prosper.
Historically, REITs have delivered solid total returns and outperformed private real estate during periods of high interest rates. Higher rates may also prove to be the impetus for private real estate portfolio managers and appraisers to finally more accurately mark their properties to market, further supporting REIT relative outperformance. Strong operational performance, well-structured balance sheets, and continued access to cost-advantaged debt should provide REITs additional flexibility to face and manage future market challenges.