While broad equity and REIT market valuation dislocations may be uncommon, historically, they have presented buying opportunities for REIT investors. As broad equity and REIT valuation multiples have moved back toward equilibrium, i.e., converged, REITs have tended to outperform broad equities.
The recent divergence between broad equity and REIT valuations was largely driven by the outperformance of AI-linked tech stocks, which started in 2023 and lingered through 2025. As the bloom started to come off the tech rally rose in early 2026, the gap between broad equity and REIT valuation multiples has narrowed and REITs have enjoyed relative outperformance.
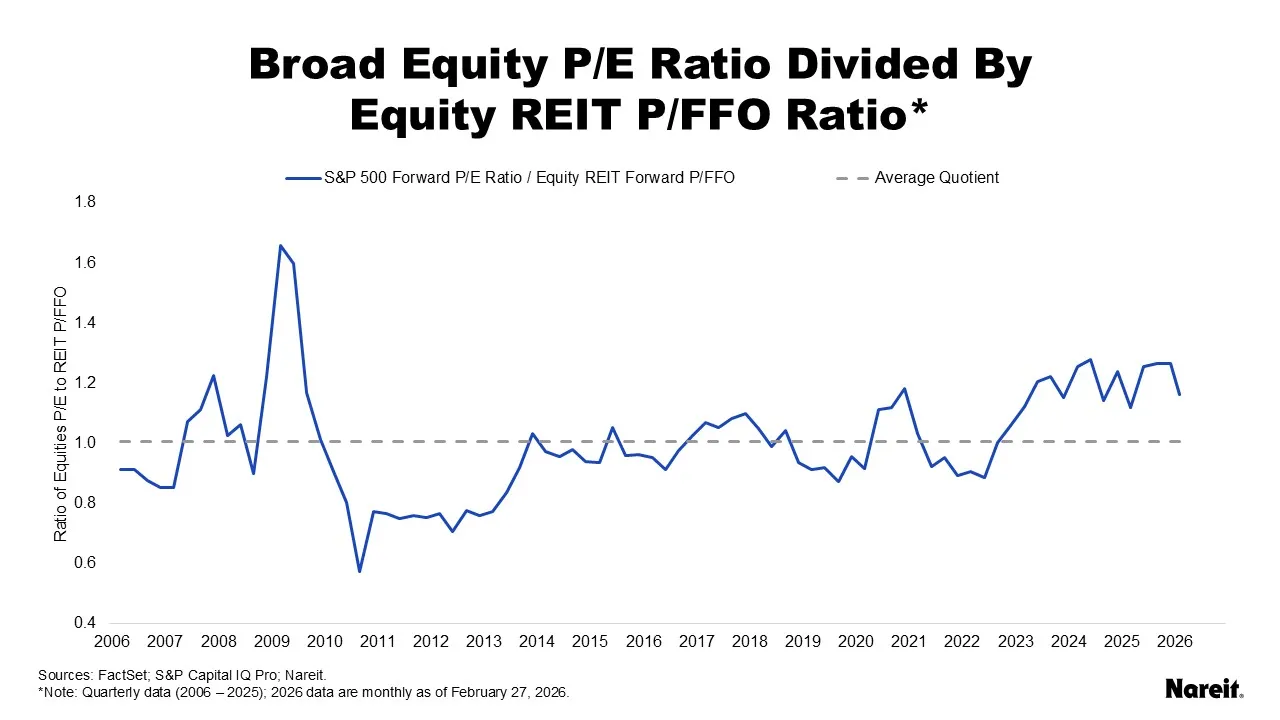
The chart above displays the S&P 500 forward (next 12 months) price to earnings (P/E) ratio divided by the equity REIT forward price to funds from operations (P/FFO) ratio, as well as an average (essentially 1) of the valuation quotients, since the first quarter of 2006. Note that the first quarter of 2026 data point reflects valuation metrics as of Feb. 27.
Since 2006, the ratio of the S&P 500 P/E to equity REIT P/FFO was significantly elevated during three periods: the global financial crisis, the COVID-19 pandemic, and the recent AI-driven tech rally. While past performance is not indicative of future results, REITs have tended to outperform broad equities as the gap between the valuation multiple metrics closed.
The current dislocation emerged in 2023. Although the broad equity-REIT valuation ratio fluctuated, it remained elevated and stood at 1.3 in the fourth quarter of 2025. As of the end of February 2026, the quotient declined to 1.2. During this time, the tech rally began to lose steam with the Magnificent Seven—Alphabet (Google), Amazon, Apple, Microsoft, Meta Platforms (Facebook), Nvidia, and Tesla—posting a total return of -6.8%. This portfolio accounts for approximately one-third of the S&P 500 equity market capitalization.
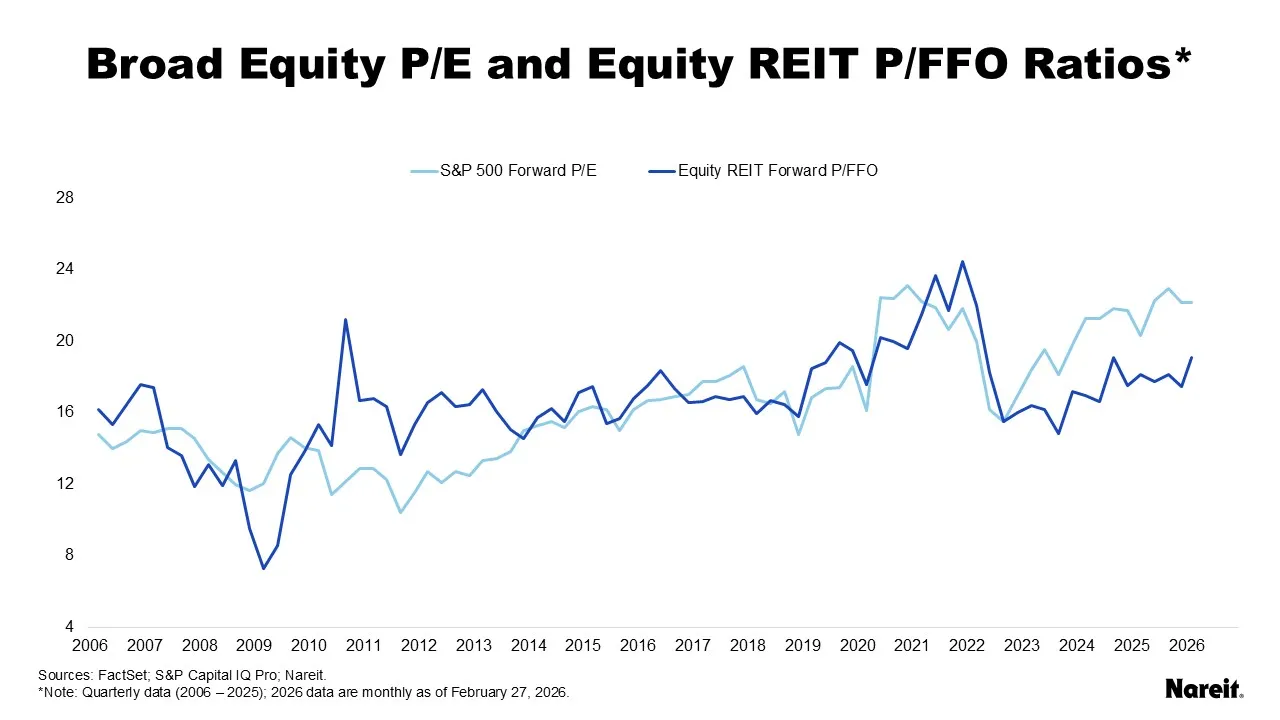
The chart above offers a slightly different perspective on broad equity-REIT divergences. It presents the S&P 500 forward (next 12 months) price to earnings (P/E) ratios and equity REIT forward price to funds from operations (P/FFO) ratios on a quarterly basis since 2006. Note that the first quarter of 2026 data point reflects valuation metrics as of Feb. 27.
In the first two months of 2026, the FTSE Nareit All Equity REITs Index and S&P 500 Index realized total returns of 10.5% and 0.7%, respectively. REITs outperformed the broad equity market by 9.8%. Not surprisingly, the gap between the S&P 500 P/E and equity REIT P/FFO ratios tightened over this time. With the start of the Iranian conflict, both REIT and S&P 500 total returns have tempered, but REITs have maintained a 9.6% year-to-date total return advantage as of March 17.
While broad equity-REIT valuation dislocations have been uncommon, these divergences have always come to an end and, based on past cycles, these convergences have favored REIT performances. Further narrowing of the current gap between broad equity and REIT valuation metrics is expected to set the stage for continued REIT relative outperformance in 2026.