Recently I’ve been publishing a series of commentaries summarizing “where we stand” in the market for listed equity real estate investment returns. The first three focused respectively on returns, correlations, and diversification benefits, followed by three others focused on valuing listed REITs using (1) spreads between the dividend yield on exchange-traded Equity REITs and the yield on 10-year U.S. Treasury securities, (2) yield spreads to Baa-rated corporate bonds, and (3) REIT stock price premiums/discounts to their net asset values (P-NAV). As I mentioned in the previous commentaries, while the purpose of valuation is to identify assets with especially good return prospects going forward, it’s very important to keep in mind that past performance is no guarantee of future performance—and, in particular, that a valuation “model” calibrated according to past returns cannot be assured of remaining valid even as a tool for predicting future returns.
It may be surprising to many investors to learn that the same data they may use to value exchange-traded Equity REITs can also be used as a tactical signal for shifting capital between REITs and non-REIT stocks. The reason is simple: REITs and non-REIT stocks are entirely different asset classes. Although they’re both equity assets that are traded on stock exchanges, their returns are driven by fundamentally different return drivers: equity REIT returns are driven by developments in the real estate market cycle, which has an average duration of something like 18 years, while non-REIT stock returns are driven by developments in the business cycle (also called the inventory cycle or simply the stock-market cycle), which has a much shorter average duration of something like 4 years. Those two cycles are not synchronized, and in fact have a low correlation averaging just around 60%. As a result, when it’s a good time to buy non-REIT stocks it tends to be a poor time to buy Equity REITs. Conversely, when it’s a good time to buy Equity REITs—and, as I noted in my previous commentaries, several different indicators suggest that this is, in fact, a good time to buy Equity REITs—it tends to be a poor time to buy non-REIT stocks.
Charts 1-4 give several examples:
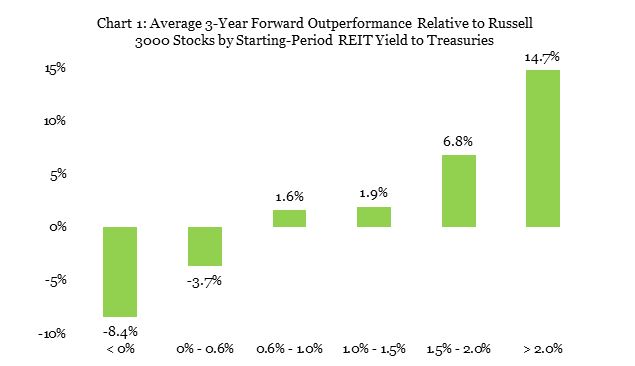
- Chart 1 shows the difference in average annual total returns between exchange-traded Equity REITs and the broad stock market (measured by the Russell 3000 index) over three-year periods based on the spread, as of the beginning of each three-year period, between the average dividend yield on Equity REITs and the yield on 10-year U.S. Treasury securities. At the end of 2016 the dividend yield spread to Treasuries was +1.47%, higher than its average value of +1.09% since the end of 1990. As the chart shows, when Equity REITs ended a month with a yield spread to Treasuries in the range of +1.0% to +1.5%, over the next three years the total returns on Equity REITs outpaced the total returns to the broad stock market by an average of 1.91 percentage points per year—and when the yield spread was in the very slightly higher range of +1.5% to +2.0%, Equity REITs outperformed the broad stock market by an average of 6.75% per year over the next three years.
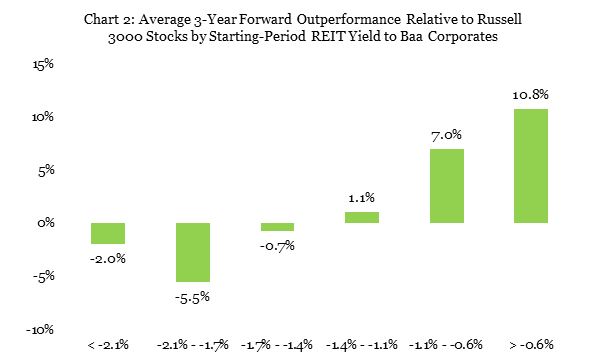
- Chart 2 shows a similar analysis based on the average Equity REIT dividend yield spread to the yields on below-investment-grade corporate bonds. At the end of 2016 the yield spread to Baa corporates was -0.87%, uncommonly high (close to zero) by historical standards. As the chart shows, since the end of 1990, when Equity REITs ended a month with a yield spread to Baa corporates in the range of -1.1% to -0.6%, over the next three years the total returns on Equity REITs outpaced the total returns to the broad stock market by an average of 6.96 percentage points per year.
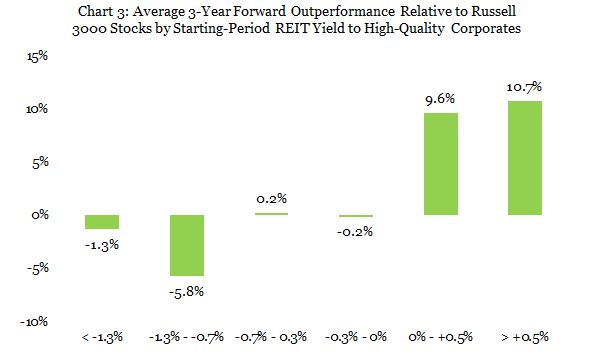
- Chart 3 shows the same analysis, but this time based on the yield spread to high-quality corporate bonds. At the end of 2016 the yield spread to high-quality corporates was +0.40%, again uncommonly high by historical standards. The chart shows that, since the end of 1990, when Equity REITs ended a month with a yield spread to high-quality corporates in the range of 0% to +0.5%, over the next three years the total returns on Equity REITs outpaced the total returns to the broad stock market by an average of 9.65 percentage points per year.
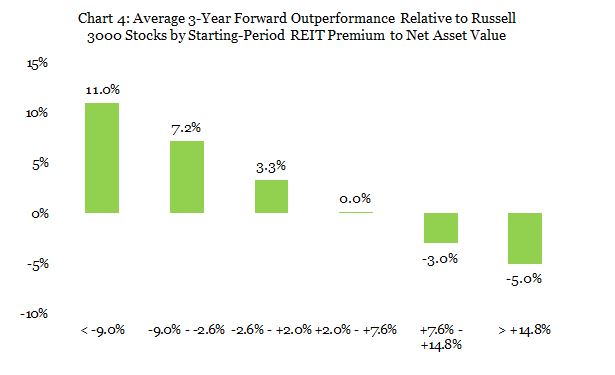
- Chart 4 shows an analogous analysis based on the average Equity REIT stock price premium or discount to net asset value (P-NAV) as estimated by Green Street Advisors. At the end of 2016 the estimated premium was -9% (that is, Green Street estimated that Equity REITs were trading at an average 9% discount to NAV), again uncommonly large by historical standards. The chart shows that, since the end of 1990, when Equity REITs ended a month with an estimated discount to NAV greater than -9%, over the next three years the total returns on Equity REITs outpaced the total returns to the broad stock market by an average of 10.96 percentage points per year, while when the estimated discount was in the range of -9% to -2.6% REITs outpaced the broad market by an average of 7.15 percentage points per year.
In short, those are all bullish signals. Is there a way to identify which of them tended to be the most reliable over the historical period? One way is to regress the difference between REIT and stock performance over every rolling three-year period since the end of 1990 on all four signals at the beginning of each three-year period. That model suggests that REIT outperformance tended to be about -2.37 percentage points plus 3.99 times the spread to Treasuries minus 0.93 times the spread to Baa corporates plus 1.13 times the spread to high-quality corporates minus 0.26 times the premium to NAV. The regression was reasonably successful at “explaining” past REIT outperformance, with an R-squared of 38.4%, and suggests that the most important variables were the spread to Treasuries and the premium/discount to NAV: not surprisingly, once the spread to Treasuries was taken into account, the spreads to below-investment-grade and high-quality corporate bonds were no longer important.
Most important, the regression confirms the bullishness of each of the four individual signals: based on the end-of-2016 values of all four signals, the regression “predicts” that Equity REIT total returns over the next three years will outpace total returns for the broad stock market by 6.61% per year on average. In other words, let’s say that we knew returns in the broad stock market were going to average 5% per year over the next three years: then this model suggests that returns to exchange-traded Equity REITs would average around 11.61% per year over the same period; if we knew that stock returns were going to average 10% per year, this model would suggest exchange-traded Equity REIT returns would average around 16.61% per year.
As I noted in my previous commentaries, one way to reduce “look-back bias” is to estimate the relationship between the four beginning-of-period signals and subsequent outperformance recursively to see how the predictions changed as “new” old data were added. For this purpose I estimated the relationship 158 times: first using 10 years of data from the end of 1990 to the end of 2000 (with returns from the end of 1993 to the end of 2003), then recursively moving up one month at a time until finally I had estimated the relationship using data from the end of 2003 to the end of 2013 (with returns from the end of 2006 to the end of 2016). Here’s what the models suggested for the coming three years based on the four market signals as of the end of 2016:
- The most bearish model was the most recent one: based on the end-of-2016 yield spreads and P-NAV discount it would future-guess returns on exchange-traded equity REITs averaging 4.10 percentage points higher per year than the returns for the broad stock market.
- The most bullish model was the one estimated using month-end market signals from September 1995 through September 2005 (and returns from the end of September 1998 through the end of September 2008): it would future-guess returns on exchange-traded equity REITs averaging 17.88 percentage points higher per year than then returns for the broad stock market.
- Half of all models would future-guess returns on exchange-traded Equity REITs exceeding returns for the broad stock market by between 7.65 and 15.70 percentage points per year over the next three years. (Another ¼ of the models would imply a guess that Equity REITs would outperform the broad stock market by between 4.10 and 7.65 percentage points per year over the next three years, and the remaining ¼ would imply outperformance of between 15.70 and 17.88 percentage points per year over the next three years.)
As with any exercise of this general sort, past returns are no guarantee of future performance and the past relationship between the four market signals that I’ve consider here and future outperformance of Equity REITs relative to the broad stock market is no guarantee that the relationship will continue to hold in the future. The bottom line, though, is similar to what I concluded in my previous commentaries: three different measures of the average Equity REIT dividend yield spread, plus the estimated average Equity REIT price discount to NAV, all seemed to be providing bullish signals at the end of 2016—and if a wide variety of estimates of the past relationship between those signals and forward-looking returns continues to hold, the signals would suggest relatively bullish future total returns for investors in exchange-traded Equity REITs, in the range of something like 4.10 to 15.70 percentage points per year greater than returns in the broad stock market over the next three years.