Macroeconomic Outlook and Commercial Real Estate Fundamentals
REITs and commercial real estate are likely to benefit in the year ahead from sustained momentum in economic fundamentals and rising demand for leased space.
By Calvin Schnure, SVP, Research & Economic Analysis, NAREIT
REITs and commercial real estate in the United States will face a number of important questions in 2017. The economic expansion and the commercial real estate cycle are both more than a half-decade old; what are the risks of a downturn? The Federal Reserve has resumed raising its target for short-term interest rates; what impact will higher rates have on financing costs, on the demand for commercial real estate and on REIT share prices? The Presidential Election surprised most observers; what impact might the incoming Administration have on the economy and commercial real estate?
While each of these issues does pose certain challenges to the outlook, we also find factors on each of these fronts that give us some confidence that conditions in real estate markets and the REIT industry will continue to improve, albeit modestly, in the year ahead. The macroeconomy maintains a significant amount of momentum but does not show alarming signs of excess. In particular, the components of the economy that have frequently risen to excess around the peaks of past economic cycles remain in more moderate ranges. Interest rate increases are expected to be gradual and muted. Changes to economic policyare still being formulated, so their impact on growth remain largely unspecified.
Macroeconomic Outlook
There are few warning signs that the economic cycle is nearing its end. We expect GDP and commercial real estate should continue to expand, and both the business cycle and the real estate cycle could well be longer than average. Four sectors highlight that macroeconomic cyclical risks should be subdued:
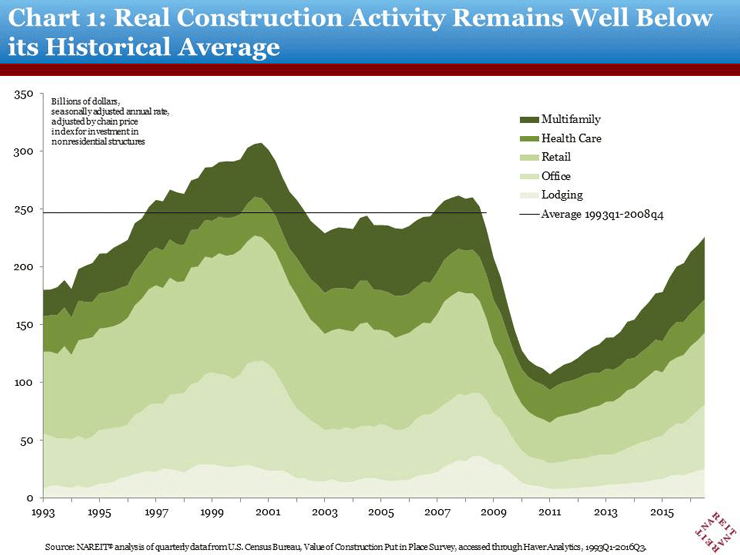
Construction of both commercial and residential properties is far from past peaks. Overbuilding of commercial and residential real estate has long been recognized as a classic sign of late-cycle risks. Despite the increases in commercial construction from its post-crisis lows and some signs of excess supply, activity on a national basis remains well below prior cyclical peaks. Construction of commercial properties, adjusted for inflation, is in line with levels 20 years ago, despite the fact that the overall economy is more than 60 percent larger [Chart 1]. Similarly, housing starts have yet to return even to their levels of the mid-1990s, and are less than half the rate during the housing boom a decade ago.
Industrial production still lags capacity. Capacity utilization often rose above 80 percent during past business cycles. Such high levels of capacity utilization typically generated bottlenecks and upward price pressures, as well as other signs that the economy was beginning to overheat. Manufacturing production has leveled off since 2014, though, and capacity utilization remains less than 75 percent, well below its long-run average.
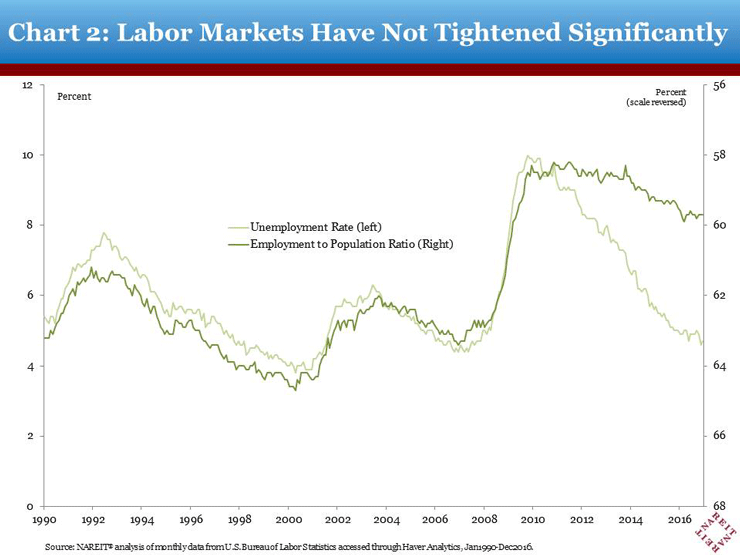
The labor market has more room to run. The unemployment rate is low, in part because several million people have left the workforce and are not looking for jobs. Many believe that a better measure of the current degree of labor market slack is the employment-to-population ratio, which indicates the labor markets are considerably less tight than the unemployment rate would suggest [Chart 2]. Modest trends in wage growth corroborate the signal from the employment-to-population ratio that the job market is not tight, and the economy has lots of upside potential without running out of workers.
Inflation is quiescent. The proof of the pudding for the Federal Reserve is price stability which, alongside of full employment, is part of its statutory mandate. Consumer prices rose 1.0 percent over the past four quarters, and core prices (excluding the volatile food and energy components) increased 1.7 percent. Both of these measures are below the Fed’s 2 percent target. The headline inflation measure has been rising from the very low levels reached in 2015 as energy prices have rebounded, but overall inflation trends are well behaved.
Although the new Administration’s stimulus plans are still being developed, at this time a surge to more rapid GDP growth does not appear to be in the cards, but neither does a recession appear imminent. The evidence weighs strongly in the direction of there being a longer than average cycle in both GDP and commercial real estate markets.
Commercial Real Estate Conditions
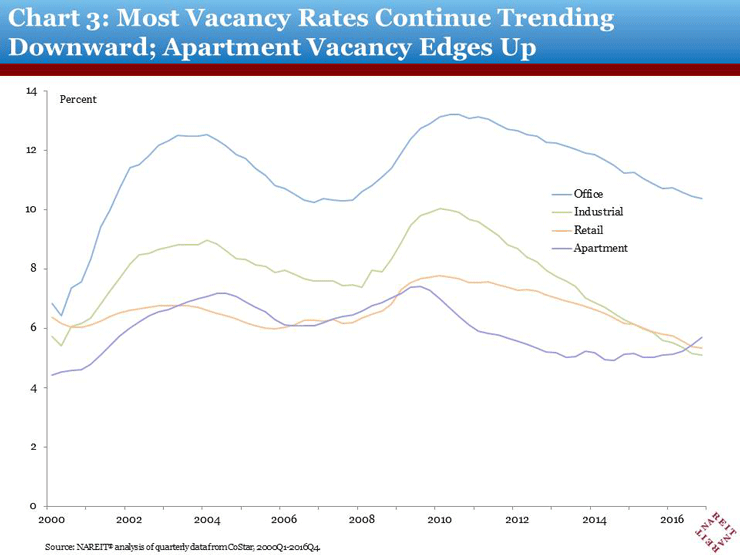
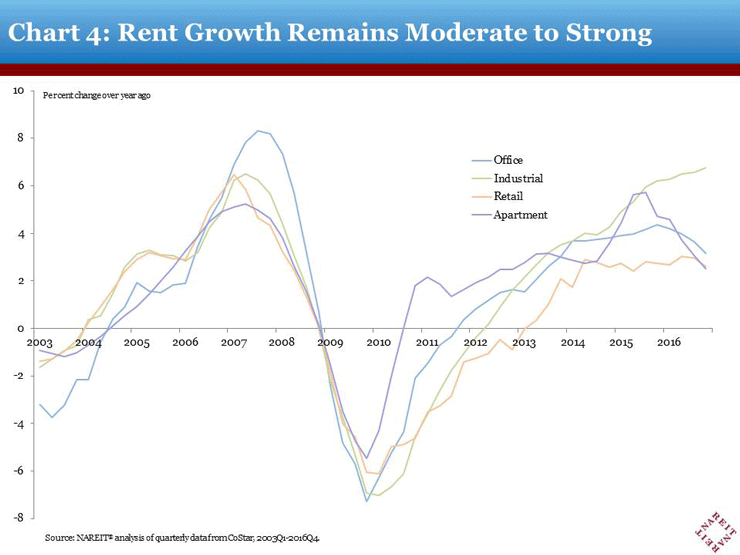
The real estate recovery is about to begin its ninth year, prompting worries that the expansion is getting long in the tooth. Indeed, the recovery is showing many signs of being complete. Vacancy rates for most property types have returned to ranges that were more typical prior to the financial crisis [Chart 3]. Rent growth, which had been stubbornly slow for the first few years of the recovery, continues at a modest pace [Chart4]. With these indicators looking similar to what took place late in the game in prior cycles, some observers have begun asking whether the market will stumble in the year ahead.
Yet a reliance on these measures alone, or on calendar time, overlooks the solid underlying fundamental forces for commercial real estate that are likely to support growth in the year ahead. Increases in demand for leased space have exceeded new supply by a wide margin, even taking into account the steady ramp-up in construction over the past five years. Net absorption—that is, the net increase in leased space—has exceeded completions over the past four quarters by 30 percent to 50 percent for major property types. The lone exception is apartment, where net absorption has hewed closely to completion for the past three years. This reflects the pent-up demand for rental housing that has built since the financial crisis, which has left most apartment markets across the country with little excess available space. The recent pace of construction has done little to satisfy this pent-up demand, and many new buildings fill up in short order, so that new demand has risen in line with completions.
Current trends in completions and net absorption are on track to keep vacancy rates trending down and support rent growth and property prices in the year ahead.
Economic Policy: The Trump Administration and the Fed
2017 is certain to bring many changes in economic policy. Legislative and regulatory activity may result in changes that could affect the economy and financial markets, including residential and commercial real estate. At this point, however, there is little basis for knowing how these policy changes may unfold or how they will influence economic activity.
Monetary policy is also in a transition zone. The Federal Reserve recently increased its target for short-term interest rates and signaled that further increases were in store in 2017. With inflation low and economic growth moderate, however, increases in both short-term and long-term interest rates are likely to be tame, and are beginning from a very low base. Within the limits of what any crystal ball can show, the economic policy and financial market landscape should be broadly supportive of real estate markets in the year ahead.
REITs
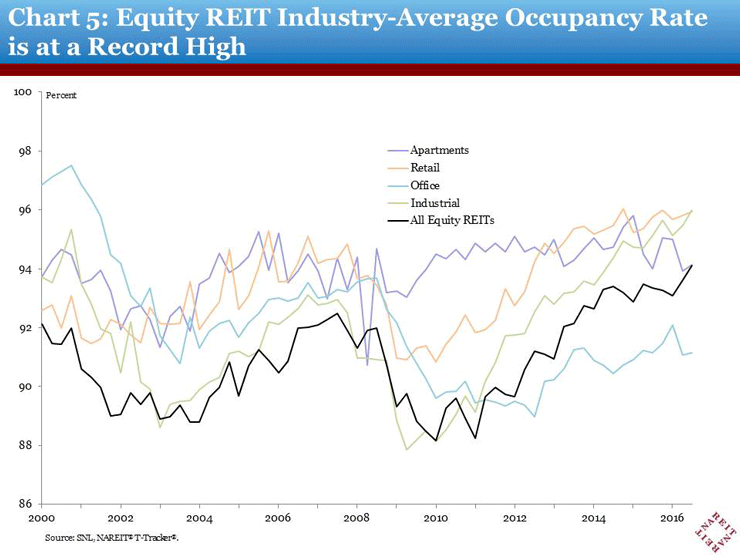
REITs have benefited from the solid growth of demand for leased space in this economic environment. The occupancy rate of all properties owned by REITs rose to a record high of 94.1 percent in the third quarter, up a half percentage point from Q2 [Chart 5]. Operating performance has improved as well, although not always in a straight line. The growth of net operating income among stores that have been open for one year or more (same-store, or SS NOI) decelerated to a 3.5 percent increase compared to the same quarter one year ago, down from growth rates as high as 5.0 percent at the beginning of this year.
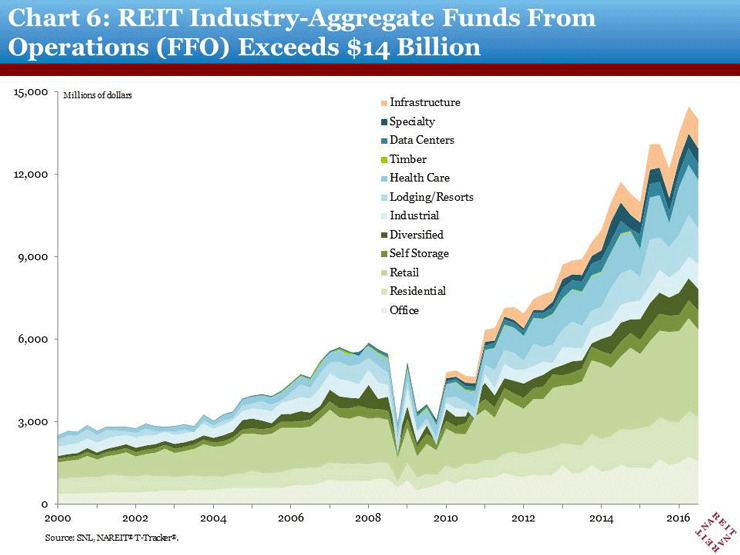
REIT earnings were at a high level in the third quarter, although there was some softening from the prior quarter. Total Funds from Operations (FFO) of all stock exchange-listed Equity REITs was $14.0 billion, according to the NAREIT T-Tracker®, down 3.3 percent from the record $14.5 billion in Q2 [Chart6]. FFO was up 6.8 percent over the third quarter of last year, however, due to solid gains in the first two quarters of this year [learn more about REIT operating performance with the NAREIT T-Tracker.]
REIT Financial Outlook and Investment Fundamentals
January 2017
Brad Case, Senior Vice President, Research & Industry Information
Returns
The FTSE NAREIT All REITs index finished 2016 with a total return of +9.28%. That may sound good, but it’s weak by the standards of exchange-traded REITs: since the end of 1990 (roughly the “modern REIT era”) total returns have been stronger than +9.28% during 15 years and weaker during only 10 years. (Going back as far as data allow, to the beginning of 1972, shows 26 years of stronger returns compared to just 18 years of weaker returns.) Long-term compound average total returns for exchange-traded REITs have been 11.45% over the 26 years since the end of 1990 and 9.74% over the 45 years since the end of 1971. Exchange-traded Equity REITs have been even more consistent with total returns averaging 11.98% per year over the 26 years since the end of 1990 and 11.93% over the full 49-year period.
The big winners during 2016 were small- and mid-cap stocks, especially small- and mid-cap value stocks: the Russell 2000 Value index, for example, posted a total return of +31.74% on the year (much of it coming during just the month of November), which is the seventh-largest annual gain ever recorded for the R2000V and the fifth-largest since the beginning of the modern REIT era. As a result, small-cap value and mid-cap value finally became the only stock categories to have outperformed Equity REITs over the duration of the modern REIT era. (Of course many REITs are also included in the broad small-cap value and mid-cap value indices.)
Over the past 26 years exchange-traded Equity REITs have outgained large-cap stocks (10.13% per year according to the Russell 1000), small-cap stocks (10.90% according to the Russell 2000), growth stocks (9.18% according to the Russell 3000 Growth), value stocks (10.69% according to the Russell 3000 Value), Information Technology stocks (11.18% according to the S&P 500 Info Tech Sector Index), Health Care and Consumer Discretionary stocks (11.13% each), Consumer Staples (10.74%), Energy stocks (10.12%), Financials (10.10%--including the healthy contribution the Financial sector received during the 25½ years while Equity REITs were part of it!), Materials stocks (8.56%), Utilities (8.36%), and Telecommunications Services (6.99%). To put some of those figures into perspective, an initial investment of $1,000 at the end of 1990 would have grown to $18,967 if invested in the stocks comprising the FTSE NAREIT All Equity REIT Index (ignoring fees) compared to just $11,638 if invested in the stocks of the S&P 500 Index, $15,714 if invested in the S&P 500 Info Tech sector, $12,202 if invested in the S&P 500 Financial sector, or $8,057 if invested in the stocks of the S&P 500 Utilities sector.
Correlations
The long-term average correlation between exchange-traded Equity REITs and non-REIT stocks has been quite low: over the same 26-year period since the end of 1990 the correlation in monthly total returns between Equity REITs and small-cap value stocks, for example, has averaged just 72%, and correlations have been even lower for Equity REITs with large-cap value (63%), small-cap growth (51%), large-cap growth (46%), and the broad stock market (58%); even the correlation between Equity REITs and their old home, the Financial sector, has averaged just 61%. For comparison, small-cap value stocks have maintained comparatively high correlations with both small-cap growth stocks (84%) and large-cap value stocks (83%) as well as the broad stock market (83%).
Correlations change over time, and a DCC-GARCH model (more or less the gold standard for estimating the most recent correlations) suggests that the correlation in monthly total returns between exchange-traded Equity REITs and the broad stock market was 56.5% as of the end of 2016, very close to the median estimated correlation over the modern REIT era. The late-2016 surge in small-cap value stocks, however, pushed their estimated correlation with Equity REITs all the way down to 45.6%, well below the normal range of 68%-80%. In short, while the factors that drive Equity REIT returns are always somewhat different from those driving the returns of non-REIT stocks, the differences between the two equity asset classes—real estate and non-REIT stocks—have rarely been more different than they are today.
Volatilities and Diversification Benefits
Exchange-traded Equity REITs are usually slightly more volatile than the broad stock market, both because many REITs are smaller companies and because the broad market encompasses a variety of companies whose stock price movements may offset each other. Over the 26 years since the end of 1990 the median annualized volatility of monthly total returns for exchange-traded Equity REITs, according to the same DCC-GARCH model, has been 15.2% compared to 14.4% for the Russell 3000 index of the broad stock market. Small-cap value stocks have been more volatile than Equity REITs about three-quarters of the time, and at the end of 2016 became especially volatile: the latest estimate of their annualized volatility was 19.7%, making small-cap value stocks 29% more volatile than Equity REITs.
Because exchange-traded Equity REITs have typically been somewhat less volatile than small-cap value stocks with a fairly low correlation but comparably high returns, REITs have typically provided strong diversification benefits to a portfolio comprising small-cap value stocks—not to mention one composed of large-cap stocks or the broad stock market. Beta for exchange-traded Equity REITs relative to the Russell 2000 Value stock index (according to the same DCC-GARCH model) has typically been between 0.58 and 0.73, but was exceptionally low at 0.35 at the close of 2016; relative to the broad market it has typically been between 0.60 and 0.88 and was on the low side at 0.67 to close the year.
Their strong returns and low systematic risk mean that exchange-traded Equity REITs have typically provided very strong alpha relative to a stock portfolio: alpha has averaged +0.33% per month (+3.97% per year, again ignoring fees) for a passively managed portfolio matching the FTSE NAREIT All Equity REIT Index relative to the Russell 2000 Value, and +0.53% per month (+6.52% per year) for the same portfolio of REITs relative to the Russell 3000 index of the broad stock market.
Current Valuations
There are those who predict weak returns for exchange-traded Equity REITs going forward, but I’m not one of them. Here’s a run-down of my reasons.
Equity REIT Dividend Yield Spread to Treasuries
Since the end of 1990 the month-end industry-aggregate dividend yield for exchange-traded Equity REITs has averaged 1.09% more than the yield on 10-year U.S. Treasury bonds. Even after recent increases in Treasury yields, the average yield spread for Equity REITs was still 1.47% at the end of 2016, which is in the top one-third of yield spreads seen during the modern REIT era. Over that period, when the industry-aggregate dividend yield spread to Treasuries finished a month in the range of 1.0% to 1.5% total returns over the next four years averaged 12.1% per year (with a median of 11.6% per year), and when spreads were in the nearby range 1.5% to 2.0% total returns over the next four years averaged 15.0% per year (with a median of 14.2% per year).
In fact, the relationship between Treasury yield spreads and four-year subsequent REIT returns can be modeled with a simple regression relationship that suggests four-year average total returns have tended to be about 6.61% plus 4.71 times the yield spread at the beginning of the period. (Note: I also modeled returns over the next three years and the next five years; all versions worked well although the four-year model suggested the best fit. Also, the relationship holds even if you eliminate the spike in yield spreads during the 2008-2009 liquidity crisis.)
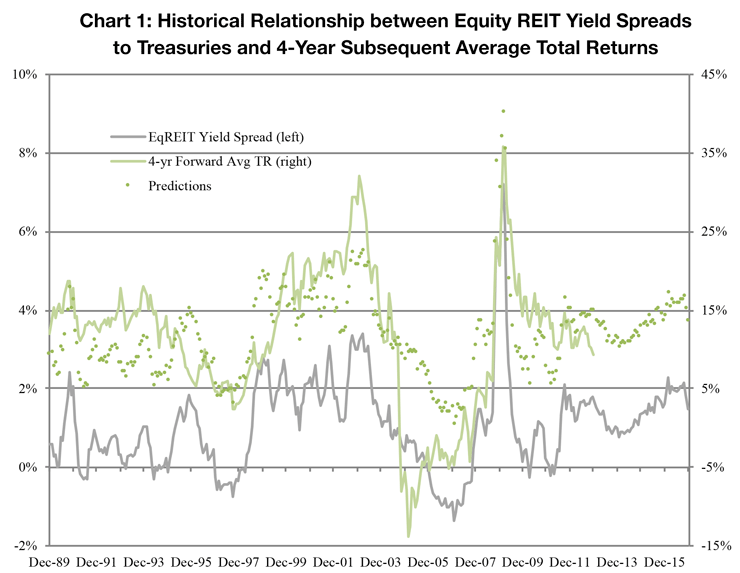
If that regression relationship continues to hold over the next four years, it suggests that total returns on exchange-traded Equity REITs would average about 13.5% per year [Chart 1]. Of course past performance is no guarantee of future results, but today’s dividend yield spread to Treasuries is in the bullish part of its historic range.
Equity REIT Dividend Yield Spread to Corporates
Dividend yields for exchange-traded Equity REITs have typically been slightly less than the yields on high-quality U.S. corporate bonds (with 10-year maturities, as estimated by the U.S. Treasury Department): since the end of 1990 the industry-aggregate Equity REIT yield spread to corporates has averaged -0.33%. At the end of 2016, however, Equity REIT dividend yields were higher than corporate bond yields at +0.40%, which is in the top one-fifth of yield spreads seen during the modern REIT era. Over that period, when the industry-aggregate dividend yield spread to high-quality corporates finished a month in the range of 0% to +0.5%, total returns over the next three years averaged 18.12% per year (with a median of 17.75% per year). As with yield spreads to Treasuries, the historical relationship can be modeled with a simple regression model suggesting that 3-year average total returns for exchange-traded Equity REITs have tended to be about 14.7% plus 7.12 times the spread to corporate yields at the beginning of the period. (The model also works well with 4-year and 5-year returns, but 3-year returns provided the best fit.)
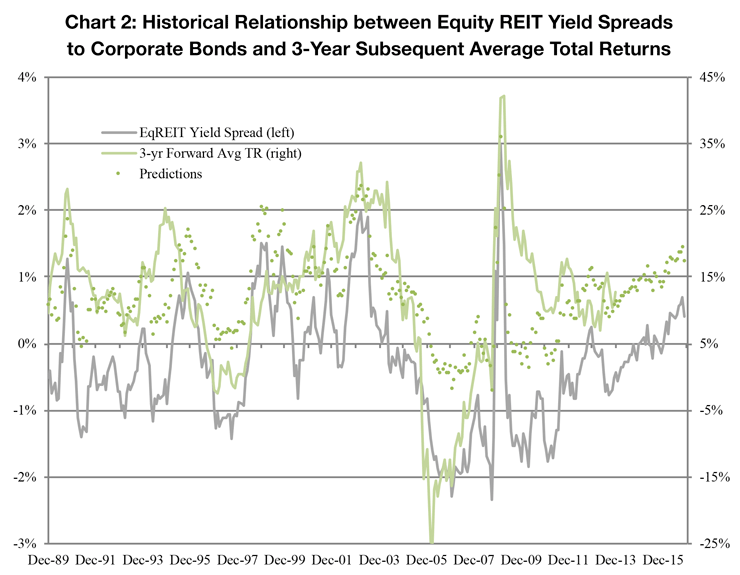
If that relationship continues to hold over the next three years, it suggests that REIT total returns would average about 17.5% per year [Chart 2]. Again, past performance is no guarantee of future results, but today’s dividend yield spread to high-quality corporates is in an even more bullish part of its historic range.
Equity REIT Stock Price Discount to Net Asset Value
A third historically useful valuation measure can be constructed by estimating the total value of the assets owned by any REIT, subtracting liabilities (primarily debt), and comparing the REIT’s stock price per share to its net asset value (NAV) per share. Equity analysts such as Green Street Advisors typically use such a calculation as an input to their equity opinions, and at least in Green Street’s case academic researchers have found (http://www.nber.org/papers/w10850) that the industry-average difference between REIT stock prices and NAVs has historically provided a fairly reliable prediction of future returns. At the end of 2016 Green Street Advisors estimated that exchange-traded Equity REIT stock prices averaged about 9% less than NAV, which is in the top one-fifth of discounts seen during the modern REIT era. Over that period, when Green Street’s estimate of the average stock price discount to NAV ended a month in the range of -10.1% or larger (that is, more negative), total returns over the next five years averaged 15.1% per year (with a median of 15.6% per year).
The historical relationship can be modeled with a simple regression model suggesting that 5-year average total returns for exchange-traded Equity REITs have tended to be about 11.7% minus 0.17 times the estimated premium at the beginning of the period. (The model works well with 3-year and 4-year returns, but 5-year returns provided the best fit. Also, Green Street’s estimates start at the end of January 1990 rather than at the end of December 1989.)
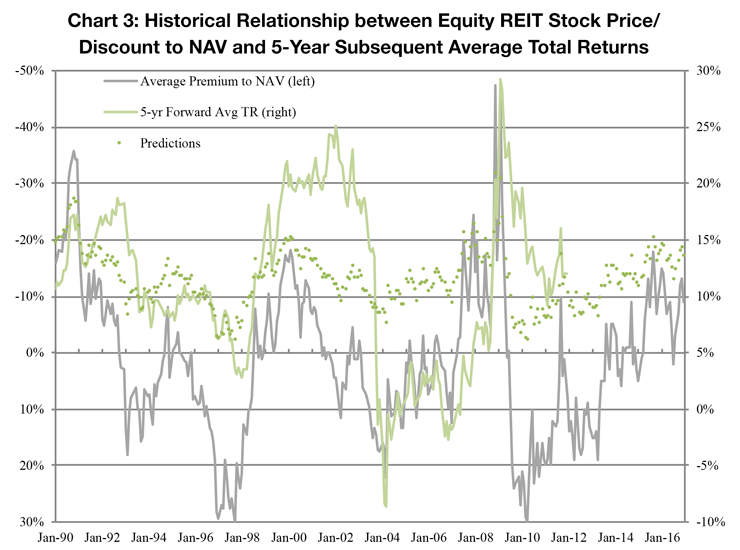
If that relationship continues to hold over the next five years, it suggests that REIT total returns would average about 13.3% per year [Chart 3]. As usual, past performance is no guarantee of future results, but today’s stock price discount to NAV, like dividend yields spreads, is in a bullish part of its historic range.
Macroeconomic Demand and Real Estate Supply Conditions
I agree with my colleague Calvin Schnure’s judgement that “conditions in real estate markets and the REIT industry will continue to improve, albeit modestly, in the year ahead.” To summarize several of the data points he presented in Section 1:
- Manufacturing capacity remains below its long-run average, suggesting little risk that production bottlenecks may choke off the current recovery.
- The employment-to-population ratio remains low, suggesting that the labor market, too, offers more upside potential than downside risk.
- Real estate construction activity remains below its long-term average: in fact construction is less now (in real terms) than it was in 1996 despite the fact that the overall economy is much larger.
- New demand for real estate has been outpacing new supply (except in multifamily, where they have run about even consistently since late 2013), and as a result both occupancy rates and rent growth have remained strong.
In short, like Calvin, I really don’t see any data that leads me to be concerned about continued improvement either in macroeconomic conditions or in real estate market fundamentals.
Interest Rates
Market interest rates have been increasing since early July 2016 and seem likely to continue increasing, perhaps for several years, so it’s a good idea to review the historical performance of exchange-traded Equity REITs during past periods of rising interest rates. The simple empirical truth is that Equity REIT returns have typically been stronger when market interest rates are going up than when they’re going down. For example, since the beginning of 1999 (when the FTSE NAREIT All Equity REITs index started reporting daily returns) the average return on days when the market yield on 10-year U.S. Treasury bonds increased has been +0.32%, compared to -0.20% on days when market yields declined. (Median values have shown the same pattern at +0.20% on increasing-rate days and -0.05% on declining-rate days.)
The relationship has been pretty consistent, too: it was true in 2000 (averages +0.09% and +0.07%), 2001 (+0.17% and -0.02%), 2002 (+0.33% and -0.20%), 2003 (+0.37% and -0.07%), 2007 (+0.39% and -0.51%), 2008 (+1.62% and -1.52%), 2009 (+1.15% and -0.77%), 2010 (+0.66% and -0.40%), 2011 (+0.74% and -0.62%), 2012 (+0.40% and -0.17%), 2014 (+0.13% and +0.05%), and 2015 (-0.01% and -0.02%). Why the relationship was reversed during 2016 (-0.03% on rising-rate days, +0.05% on declining-rate days) remains a mystery to me, as well as why it didn’t hold during 1999, 2004-2006, or 2013. (By the way, the relationship doesn’t depend on using the market yields on 10-year Treasuries: it holds when you use other interest rates, too.)
The reason why Equity REIT returns have usually been better when interest rates are increasing, however, is no big mystery: when market rates are increasing, it’s generally because the economy is getting stronger—increasing the demand for investment capital, and therefore the price of investment capital (aka interest rates)—and when the economy is getting stronger that generally means increases in occupancy rates, rent growth, net operating income, equity asset values, and dividends for investors in Equity REITs. And that’s certainly the market environment that has been causing interest rates to creep up over the last six months.
Inflation
Some economists and investors have raised the concern that inflation may pick up as the economy strengthens, so it’s helpful to note the inflation-protecting properties of investments in exchange-traded Equity REITs. Data going back to the beginning of 1972 (remember those high inflation rates in the late 1970s and early 1980s?) suggest that when inflation has been relatively high for extended periods, Equity REIT total returns have exceeded them 69% of the time. That record has been matched only by the energy-heavy GSCI commodities index, but commodities, unlike REITs, present a huge risk of guessing wrong about future inflation: when inflation has been high the total returns on REITs and commodities have both been strong (averaging 13.7% per year and 17.6% per year respectively), but when inflation has been low the total returns on REITs have remained strong averaging 11.95% per year whereas commodity returns have collapsed to a dismal average of -7.34% per year.
Normal Duration and Strength of Real Estate Bull Markets
Back in 1933 Homer Hoyt, the first important real estate market researcher, observed that real estate market cycles seem to have an average duration of about 18 years. While high-quality data don’t extend back farther than 1972, the most recent two complete real estate market cycles were remarkably close to Dr. Hoyt’s observation: the first lasted 17 years from September 1972 through August 1989, and the second lasted 17½ years from August 1989 through January 2007. I measure each cycle from its peak, so each encompasses a cyclical downturn lasting 27 months from September 1972 through December 1974 in the first case, 14 months from August 1989 through October 1990 in the second case, and 25 months from January 2007 through February 2009 for the current cycle. The current real estate market cycle (measured from the peak of the previous cycle) won’t reach even 10 years of age until the end of January 2017. (Note that a cyclical bull-market doesn’t mean every month or quarter or even year will be positive: for example, there was a significant mid-cycle downturn in exchange-traded Equity REITs during 1998-1999 that seems to have been caused by investors reallocating capital from REITs to tech companies during the dot-com bubble—but that downturn was not a cyclical real estate bear market.) The total returns on exchange-traded Equity REITs averaged 13.9% per year during the 17-year cycle from 1972 to 1989, and another 14.3% per year during the 17½-year cycle from 1989 to 2007. During the current cycle, however—which has so far included all of the cyclical downturn of 2007-2009 but only part of the cyclical bull market—total returns have averaged just 4.3% per year, implying plenty of upside potential over the next several years.
Focusing on cyclical bull markets, the completed bull market from December 1974 through August 1989 lasted 14 years 8 months with total returns averaging 19.9% per year, while the completed bull market from October 1990 through January 2007 lasted even longer at 16 years 3 months with total returns averaging 17.3% per year. In contrast, the current bull market has been going just 7 years 10 months so far, and total returns have averaged just 22.1% per year despite the fact that the bull market started from the depth of a liquidity crisis much more severe than either of the two previous troughs. In fact, the current bull market is quite consistent with the first 7 years 10 months of the earlier bull market (December 1974 – September 1982 with total returns averaging 22.1% per year) and would not be dramatically different from the first 7 years 10 months of the most recent cyclical bull market (October 1990 – July 1998) except for the fact that 1998 marked the start of the “dot-com” mid-cycle downturn.
Again, past performance is no guarantee of future results, but there doesn’t seem to be anything unique about the current real estate market cycle other than the severity of the downturn that started it—and the previous cycles lasted about seven years longer with continued strong returns.
Concerns
I’ve painted a fairly upbeat picture of “where we stand” in the market for equity real estate investment returns, but even a cloudless day will have pockets of shade. What are the sources of risk in what is otherwise a fairly sunny outlook?
For me there’s no question: my greatest concern stems from the continued rich valuations attached to properties in the private (illiquid) real estate market. Properties are long-lived and difficult to value, and it’s very possible that private-market participants have valued properties using discount rates that are too low, resulting in inflated estimates of current property values. In many cases these inflated valuations are reflected not just in appraisals (whether internal or external) but also in transaction prices. For example, the long-term relationship between public-market pricing (stock values of exchange-traded Equity REITs) and private-market appraisals reflected in the NCREIF Property Index (NPI) suggests that the NPI was overvalued by about 9¼% as of its latest reading, 2016q3, with the implied overvaluations most severe in the industrial, retail, and office property types. At the same time, the long-term relationship between public-market pricing and NCREIF’s Transaction Based Index (NTBI) suggests that the NTBI was about 7¼% above where the public-market pricing suggests it would normally have been, with the overvaluations again concentrated in the industrial, retail, and office property types.
Indices covering the broader private real estate market provide even more basis for concern. The long-run relationship between public-market pricing and the Moody’s/RCA Commercial Property Price Index (CPPI) suggests that as of the end of October 2016 the CPPI, which is based on repeat-transacting properties with values of at least $2.5 million, was about 20% above where it ordinarily would have been; similarly, as of the end of November 2016 the CoStar Commercial Repeat-Sale Index (CCRSI), which applies a similar methodology to an even broader sample of properties, seemed to be about 23% higher than it ordinarily would have been.
How will those gaps close? Of course one outcome would be for REIT stock prices to rise significantly—and, as I noted previously, there is reason to think that REIT returns have room to increase. On the other hand, it’s possible that asset owners and investors in the private real estate market will pull back on the optimism that has driven them to value their properties so highly and to pay such rich prices for them. As usual, it’s reasonably likely that the resolution of the current public/private valuation mismatch will involve some movement on both sides.
Summary
It’s inherently difficult to predict the future, especially at a time when changes in political leadership at the national level introduce so much additional uncertainty regarding the conditions that promote macroeconomic growth. This much is easy to see, though: investing in equity real estate through exchange-traded Equity REITs has provided favorable long-term returns with low correlations to non-REIT parts of the stock market and slightly lower volatility than otherwise similar non-REIT stocks. There certainly are reasons to be optimistic that the cyclical REIT bull market that began in March 2009 could provide several more years of strong returns; the only significant concerns that I have are focused on the reported pricing of properties on the private side of the real estate market. On balance, though, it seems like a good time to be a REIT investor.