REITs: Looking Back on 2017 and Looking Forward to 2018

By Brad Case, SVP, Research & Industry Information, Nareit
The big story of 2017 for REIT investors was how dramatically they underperformed the broad stock market. That’s a terribly misleading summary of the past year, but it’s useful for framing expectations for 2018.
During 2017 the REIT industry generated total returns of 9.27 percent according to the FTSE Nareit All U.S. REITs Index. That's very close to their long-term average. From the beginning of 1972, when the All U.S. REITs Index was created, through the end of 2017 total return had averaged 9.72 percent per year. That should come as no surprise, as REIT performance has been remarkably consistent: this year's total return has been quite close to the average annual industry performance over the past five years (9.90 percent), 15 years (10.62 percent), 25 years (10.47 percent), 35 years (9.86 percent) and 45 years (9.69 percent).
My “review and outlook” can be summarized in three statements:
1. REITs during 2017 were overlooked and undervalued.
2. REITs are in the sweet spot for strong operating results.
3. REITs may be poised for outperformance in 2018.
REITs in 2017: Overlooked and Undervalued
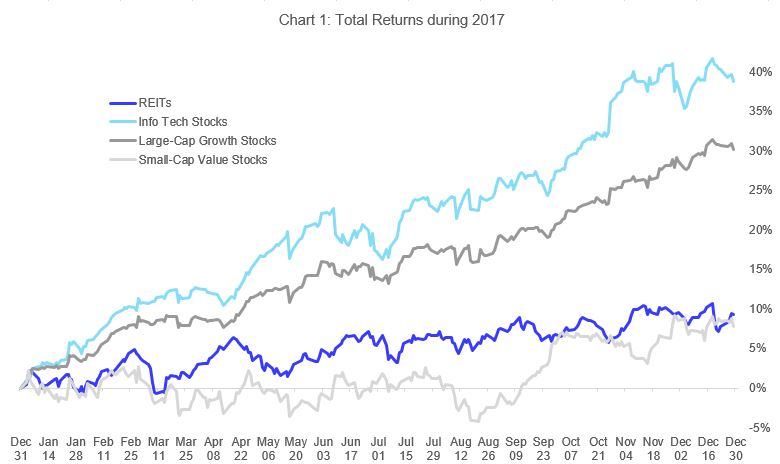
As I noted above, REIT performance in 2017 was utterly normal: what made 2017 remarkable is how abnormal the returns in other segments of the stock market have been—and how narrowly distributed. The resurrection of what was once called “irrational exuberance” has affected almost exclusively the large-cap growth segment of the market, especially large-cap information technology companies. The Russell 1000® Growth Index of large-cap companies with “growth” attributes, which is dominated by info tech companies such as Apple, Microsoft, Facebook, and Alphabet, gained 30.21 percent, as shown in Chart 1, while the S&P 500 Information Technology Sector returned a stunning 38.83 percent; in contrast, the Russell 2000® Value Index of small-cap companies with “value” attributes had returned a paltry 7.84 percent.
It may be useful to remember what we mean when we use the terms “growth” and “value.” A “growth” company is not defined as one whose returns are expected to grow strongly: instead, it’s a company whose stock price is already inflated relative to its earnings or the book value of its assets. (It’s called “growth” only because the inflated level of its stock price would make sense only if its earnings grew dramatically.) A “value” company is defined as one whose stock price is low relative to its earnings or the book value of assets.
In other words, “growth” companies are essentially defined as overvalued companies that can be expected to underperform in the future, whereas “value” companies are essentially defined as undervalued companies that can be expected to outperform in the future. Long-term performance comparisons bear out those definitions: small-cap value stocks have dramatically outperformed large-cap growth stocks since mid-1926 with total returns averaging 14.82 percent per year vs 9.72 percent per year, according to data maintained by economist Kenneth French of the famous Fama-French stock market research team.
In fact, according to the long-term Fama-French data, the kind of performance discrepancy that we’ve observed this year is extremely rare. Since mid-1926 it has happened only six percent of the time—and the two most prominent examples were during the 1929 market bubble that ended with “Black Tuesday” and the dot-com bubble of the late 1990s that, as we saw again this year, was dominated by info tech stocks.
REITs are generally quite different from the small-cap value segment of the non-REIT stock market: the long-term average performance of the two categories is very similar, but REITs have usually been less volatile and the correlation between them has typically been only about 70 percent. Still, the small-cap value segment is more like REITs than any other segment of the stock market is, so comparisons are natural. During 2017 REITs outperformed the Russell 2000 Value Index (9.27 percent vs 7.84 percent) with substantially less volatility (11.7 percent vs 15.9 percent at the end of December) and an exceptionally low correlation (52 percent at the end of December).
It’s a comfort that REITs outperformed the part of the stock market that has typically been most similar to them—but, after a year when investors’ attention was fixated on tech stocks, REIT investors will look forward to being more clearly in the spotlight during 2018.
REIT Operating Environment: Solid and Promising
The “fundamental business” for REITs is managing their real estate assets to produce strong operating performance by maintaining high occupancy rates and strong rent growth. On a long-term basis, REITs have managed their properties to achieve consistent growth in net operating income (NOI) in the range of 2.5 percent to 4 percent per year on a same-property basis, according to the T-Tracker® quarterly operating performance series published by Nareit . (Aggregate NOI growth for the REIT industry has averaged 7.3 percent per year since the beginning of 2000, but roughly half of that has come from the growth of the industry rather than operating performance at the same-property level.)
Current operating performance for the REIT industry is right in its “sweet spot”: over the last four quarters, same-property NOI growth averaged 3.2 percent, consistent with the industry’s long-term norm. Same-property NOI growth greater than about 4 percent can be “too much of a good thing,” stimulating so much new construction that it results in oversupply that reduces occupancy rates and rents, eventually suppressing same-property NOI growth to its “soft” range of 2.5 percent or less.
And there’s every reason to think that real estate operating fundamentals will maintain that “sweet spot” for a relatively long time. Operating fundamentals are driven by demand and supply conditions in the real estate market, and both of those seem to be well balanced. My colleague Calvin Schnure has estimated a 60 percent probability that GDP growth in 2018 will remain in the range of 2.2 percent to 2.5 percent , with a 30 percent chance of surprisingly strong growth and only a 10 percent chance of a slowdown. GDP growth translates to growth in demand for real estate (we like to say that “REITs house the economy”), so continued moderate expansion in macroeconomic growth should support continued moderate expansion in demand for REIT-owned properties.
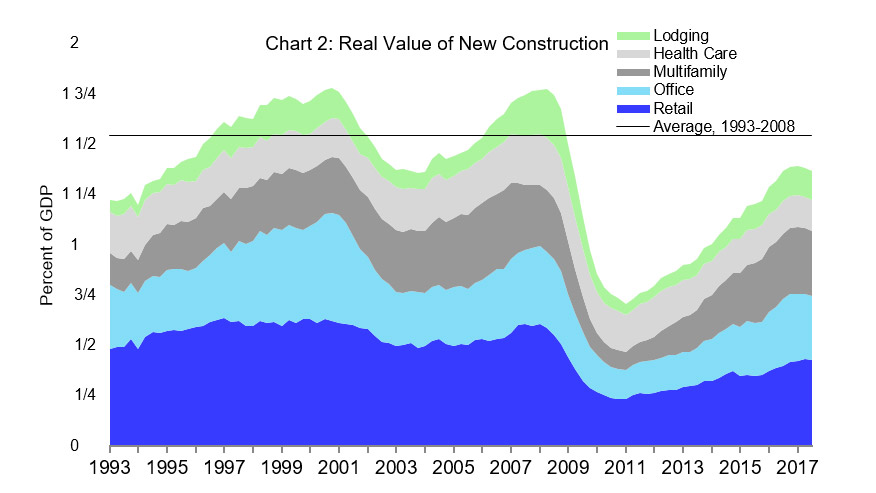
Supply conditions are equally favorable: as Chart 2 shows, even though the pace of new construction has been strong since 2011, the value of new construction hasn’t even fully recovered to the level of just over 1½ percent of GDP that was normal prior to the construction collapse that began in 2008. As with NOI growth (and GDP growth), too-aggressive growth in construction would become “too much of a good thing”—but construction activity has, in fact, moderated during 2017, reducing concerns that it could give rise to an oversupply problem.
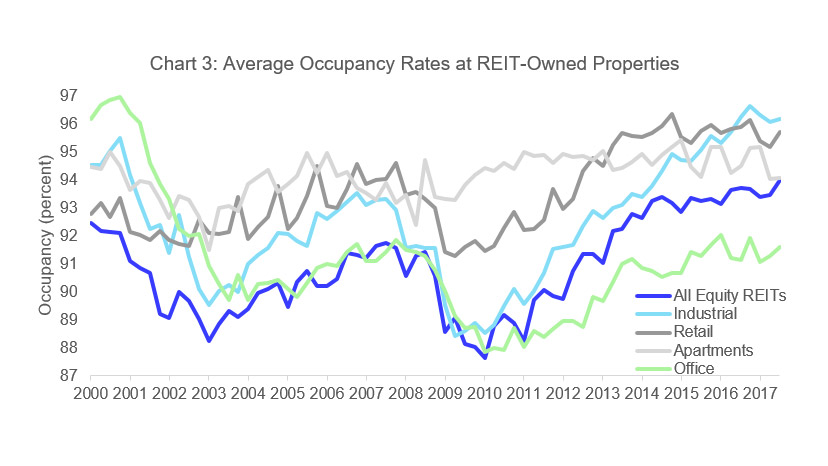
The combination of moderate but steady growth in demand and moderating growth in supply has helped REITs maintain high average occupancy rates, as shown in Chart 3. In fact, the industry-average occupancy rate has held steady in the range of 93 percent to 94 percent for four full years, since the end of 2013—and many investors may be surprised to learn that occupancy rates for REIT-owned retail properties has been higher than 95 percent in every single quarter since early 2013. Investors should never lose sight of the fact that real estate is an actively managed asset: a high-quality, well-managed property—which describes most properties owned by REITs, certainly including retail properties—is more likely to maintain strong occupancy and favorable NOI growth than a property whose owners are merely waiting out the life of their private equity fund before selling.
In short, the operating environment for REITs has been solid, both demand and supply drivers have been favorable, and I expect—most importantly—that a strong operating environment will persist through 2018, if not indeed for several more years to come.
Performance Expectations for 2018
Yet REITs were overlooked during 2017—and, as a result, are undervalued.
Investors can use any of several models to determine whether REITs are undervalued or overvalued. Among other methods, they can estimate the value of each REIT’s properties and compare its stock price to the per-share value of its asset portfolio net of debt and other liabilities (the P-NAV method) or they can predict each REIT’s funds from operations over the next year to form an earnings valuation ratio (the P/FFO method). I prefer a method that is simpler but that has proven to be remarkably dependable in the past: comparing REIT dividend yields to the yields on other investments that, like REITs, provide strong and steady income streams.
As an example, as of the start of 2018 the average dividend yield for equity REITs was 3.94 percent according to the FTSE Nareit All Equity REIT Index. Since the beginning of 1990 there has been a remarkably consistent relationship—with a correlation of more than +90 percent—between equity REIT dividend yields and the market yields on Baa-rated corporate bonds as tabulated by Moody’s. Baa-rated bond yields have typically been about 130 basis points higher than equity REIT dividend yields, and the spread between them has usually been between 80 and 180 basis points. At the beginning of the year, though, the Baa-rated corporate bond yield was just 4.23 percent, meaning that the REIT-Baa spread was extraordinarily small at just 29 basis points.
Deviations from the historically normal 80-180 bp spread between REIT dividend yields and Baa-rated corporate bond yields have generally provided a surprisingly reliable valuation signal and a surprisingly reliable predictor for future performance. The reason is simple: given the extremely steady pace of REIT dividend distributions, major changes in the yield spread arise primarily because REIT stock prices have been driven too high or too low relative to their future performance expectations.
- When the yield spread has been in its normal range—with Baa corporate bond yields between 80 and 180 basis points greater than REIT dividend yields—over the next year REIT total returns averaged 13.44 percent and outpaced the broad stock market (Russell 3000) by an average of 2.53 percentage points.
- At times when the yield spread was greater than 180 basis points—that is, when REIT dividend yields were extraordinarily low, reflecting REIT stock prices that were especially high relative to their current distributions—REIT performance over the next year tended to be weak, with total returns that averaged 6.98 percent and underperformed the broad stock market by 1.84 percentage points.
- At times when the yield spread was less than 80 basis points—when REIT dividend yields were extraordinarily high, reflecting REIT stock prices that were especially low relative to current distributions—REIT performance over the next year tended to be especially strong, with total returns that averaged 20.81 percent and outpaced the broad stock market by 5.67 percentage points. That, folks, is where we are now.
- To take the extreme case, it’s very rare for the Baa-rated corporate bond yield to be less than the average REIT dividend yield: that has happened only at times when investors were most dramatically avoiding REITs, most recently in March 2009 at the lowest point of the Great Financial Crisis—and in the 12 months following that episode, those investors who bucked the market and bought into REITs were rewarded with total returns that exceeded 100 percent.
The historical data can also be used in a regression, as shown in Chart 4. The yield spread (shown in grey) was extraordinarily high—in fact, it was positive at +0.51 percent—at the end of 1999, a time much like today when REITs had become “overlooked and undervalued” as the tech stock bubble inflated relentlessly. The regression predicted extraordinarily high returns for REIT investors over the next 12 months at +29 percent—and indeed investors who bought in to REITs at that time were rewarded with total returns averaging +26.37 percent that outpaced the broad stock market by 33.83 percentage points.
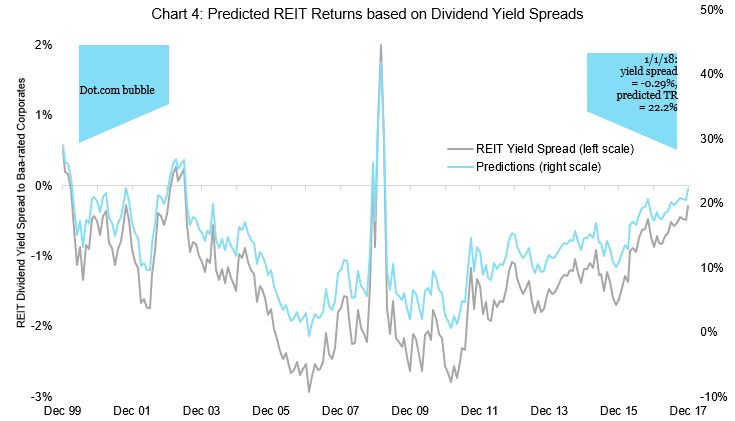
As the tech bubble burst and investors rediscovered REITs, the REIT dividend yield spread to Baa-rated corporates declined steadily until it reached its lowest value of -2.94 percent at the end of January 2007. At that level REIT total returns over the next 12 months were predicted to be negative and to underperform the broad stock market—and both predictions were true, although the model failed to predict the severity of the downturn with REIT returns of -23 percent underperforming the stock market by 20 percentage points during those 12 months.
The right edge of Chart 4 shows the most current prediction from the regression model. If the historical relationship continues to hold, then the dividend yield spread of just -0.29 percentage points as of the beginning of January 2018 would translate to REIT total returns of 22.18 percent over the next 12 months and to REITs outperforming the broad stock market by 6.68 percentage points.
Three Critical Rules for Successful Investing
As you look back on the past year and develop your investment strategy for the coming year, it may be helpful to keep in mind three rules that prominent investors have used to guide their tactical decisions.
First, don’t simply follow the crowd. If you make the same decisions that everybody else makes, you can do no better than keep up with them—but if the market changes and you find yourself caught flat-footed, you may end up holding the bag for everybody else. When others, blinded by “irrational exuberance,” are paying extraordinarily high prices to buy, the thoughtful tactic is to be the one benefiting from those high prices by selling. Plenty of investors have simply put their money on those large-cap growth stocks that outperformed earlier this year; most of those investors will continue to “ride the hot hand” with no thought to when the ride will end, and they’ll be joined by others who convince themselves that it’ll never end. It always does.
Second, invest in strong, sustainable underlying operating fundamentals. Plenty of investors will buy into a dream—and most of them will end up with little more than the memory of the dream. Instead, look for actual evidence that the pace of new construction is keeping up with growth in demand: evidence such as increasing employment, household formation, and retail trade volumes, rising occupancy rates, positive rent growth, and growth in same-property NOI. If you invest in sustainable operating fundamentals, the value of your holdings will always find support.
Finally, look for undervalued assets. If you’ve followed the first two rules, the third will be almost automatic: if the crowd has rushed in then the crowd’s assets will be overvalued, so if you separate yourself from the crowd and focus on a strong operating environment instead, you will almost certainly find assets that have become “overlooked and undervalued.” In the current market situation, that certainly describes REITs.
May 2018 be a successful year for you.
If you have any questions or comments, please drop me a note at bcase@nareit.com.
Top Issues to Watch for Real Estate Markets in 2018

By Calvin Schnure, SVP, Research & Economic Analysis, Nareit
The macroeconomy and real estate markets had a good performance in 2017. Real GDP rebounded to annualized growth rates above 3.0 percent in the second and third quarters. Commercial properties in most markets enjoyed sustained growth of demand, high occupancy rates, rising rents and rising prices.
These advantageous conditions may well continue into 2018, but there are several risks that might cause a change in the outlook. Will GDP growth and the job market run out of steam next year? The Fed has signaled that further increases in interest rates are on their way; how far will they raise rates, and what will be the impact on commercial real estate? Commercial construction has been on an uptrend for several years; will demand growth keep up?
Following are the top ten developments in the economy and real estate markets to watch in 2018. For each issue, I lay out several possible scenarios for what might take place, as well as my own assessment, in bold italics, of the odds of each possible outcome, and a brief discussion of why.
GDP
GDP growth accelerated in the second and third quarters, lifting the total change over the past four quarters to 2.3 percent.
Will GDP growth in 2018:Q4 compared to a year earlier (a) slow to less than 2.2 percent (I estimate a 10 percent probability of scenario (a) occurring); (b) stay between 2.2 percent and 2.5 percent (60 percent probability); (c) accelerate above 2.5 percent (30 percent probability)?
My outlook on GDP is relatively optimistic, with more upside potential than downside risks. The typical issues that cause recessions—overbuilding, overheating, over-leveraging—are not present. Monetary and fiscal policy conditions are supportive of growth.
Wages
Wage growth has lagged compared to previous economic recoveries. Growth of average hourly earnings picked up slightly over the past year or so, to 2.4 percent in the 12 months through October, barely ahead of the 2.1 percent average rate from 2011 through 2015.
Will average hourly earnings in 2018 rise (a) less than 2.3 percent (10 percent chance); (b) between 2.3 percent and 2.6 percent (45 percent); (c) more than 2.6 percent (45 percent).
The job market is tightening, which will put upward pressure on wages; I see little risk of earnings growth slowing significantly. There are still many discouraged workers and others who have left the labor force, though.
The key issue in 2018 is whether these people return to the labor force, boosting employment growth but keeping wages in check, or remain out of the labor force, allowing wage pressures to build? I see a toss-up between these two scenarios—but either outcome, faster job growth with steady wage gains, or steady job growth with an acceleration in wages, would boost household incomes and economic fundamentals. Either scenario (b) or (c) would be favorable for commercial real estate.
Inflation
Inflation has been running below the Fed’s 2 percent target, with the core PCE deflator rising 1.4 percent over the 12 months through October. The Federal Reserve has a dilemma. They don’t want inflation rates to fall too far, as this limits their ability to boost a weakening economy, but neither do they want tightening labor markets to overheat and lead to accelerating inflation.
In 2018, will inflation (a) remain well below the Fed’s target, with the core PCE deflator rising 1.7 percent or less (my odds of this outcome are 60 percent); (b) move in line with the target, rising between 1.7 percent and 2.2 percent (35 percent); (c) overshoot the target, rising more than 2.2 percent (5 percent)?
There’s little risk of the economy overheating; in fact, the millions of people who are currently out of the workforce are a safety valve against wage and price pressures. Inflation next year is more likely to undershoot than overshoot.
Federal Reserve
The Fed’s “Dots” chart shows the median policymaker’s response for the Federal funds rate at the end of 2018 to be 2.125 percent, indicating they expect three rate hikes of 25 basis points in 2018.
At the end of 2018, will the Federal funds rate be (a) 2 percent or less (i.e. below the dot representing the middle response of FOMC members; I see a 30 percent chance of the Fed keeping interest rates at 2 percent or less); (b) between 2 percent and 2.25 percent (on the median dot—this is the most likely outcome, at 55 percent); (c) more than 2.25 percent (above the dots, a 15 percent chance)?
There’s more slack in the labor market than indicated by the unemployment rate, and this will likely keep wage growth moderate and inflation below the Fed’s target. This suggests a 3-in-10 chance that rates will rise by less than expected. FOMC members are concerned that inflation will show up only with a lag, though, and I see policymakers most likely will continue with moderate rate increases as a hedge against future inflation. There is little risk, however, of more aggressive tightening.
Long-term interest rates
The yield on the 10-year Treasury note ranged between 2.00 percent and 2.50 percent throughout 2017. The Federal Reserve, however, is not only raising short-term interest rates, but they are also allowing their $2.5 trillion portfolio of Treasury securities to shrink, potentially putting upward pressure on long-term interest rates.
At the end of 2018, will the yield on the 10-year note be (a) below 2.50 percent (20 percent chance); (b) between 2.50 percent and 3.00 percent (70 percent chance); (c) higher than 3.00 percent (10 percent chance)?
Nearly everything I see suggests increases in long-term rates, but with inflation under control, the increases will likely be modest. In the event of a geopolitical event or other crisis, though, a flight to quality could push Treasury yields down significantly.
Multifamily properties
Rising supply helped push national vacancy rates above 6.0 percent at the end of 2016, from a low of 5.3 percent in mid-2014, according to data from CoStar. Demand for apartments rebounded in the first three quarters of 2017, however, reversing part of that rise, as vacancy rates edged down to 5.8 percent as of the third quarter. Construction has leveled off, but remains well above the pace a few years ago.
Will multifamily vacancy rates (a) move back above 6.0 percent (unlikely; I see the odds at 10 percent); (b) stay in the 5.5 percent to 6.0 percent range (most likely, with a 70 percent probability); (c) fall below 5.5 percent (20 percent chance)?
 Apartment markets are more likely to tighten further in the year ahead. The number of doubled-up households that contain additional adults living in the house or apartment, whether an adult child or unrelated roommate, is still at a historically high point. This pent-up demand will provide tenants for the new units. The main risk for the sector is not the new supply, but that sluggish wage growth makes high rents unaffordable to many of the potential tenants.
Office markets
Office rent growth has slowed, with asking rents in the third quarter 1.5 percent above one year earlier, according to CoStar, down from increases approaching 6.0 percent in 2015. There has been more construction, but completions over the past four quarters were still less than 0.9 percent of the existing stock, which is well below the pace in the 2000s.
Will office rents in the fourth quarter of 2018 be (a) less than 2.0 percent higher than in the fourth quarter of 2017 (the odds of continued sluggish rent gains are 30 percent); (b) rise a bit faster to be 2.0 percent to 3.0 percent higher (40 percent chance); or (c) accelerate to more than 3.0 percent over the prior year (30 percent chance)?
The rent slowdown appears at odds with trends in overall job growth. Several one-off factors damped office-using employment in Gateway cities over the past year or two; for example, financial sector jobs were flat to down in New York City, and tech employment and venture capital slowed in the San Francisco Bay Area. Job growth overall has decent momentum, however, and the sectors that had been weak recently are already showing signs of renewed life. Meanwhile, several secondary markets like Seattle, Dallas, Denver, and Nashville are enjoying robust population and employment growth.
Retail property markets
Retail REITs have maintained high occupancy rates, despite retailer bankruptcies and store closures, by attracting new tenants including those providing services and offering “experiences”. In fact, the Nareit T-Tracker® shows the overall occupancy rate of properties owned by Retail REITs was 95.7 percent in the third quarter, and has remained above 95.0 percent since early 2013.
In 2018, will the occupancy rate of Retail REITs (a) fall below 95.0 percent (unlikely; 10 percent chance); (b) be in a range between 95.0 percent and 96.0 percent (likely; 50 percent chance); (c) rise above 96.0 percent (also possible, 40 percent chance)?
An important factor to keep in mind is that REITs own many of the top-quality malls and shopping centers, and have demonstrated an ability to find high-productivity tenants. E-commerce will continue to force retail stores to adapt how they serve consumers, but bricks and mortar stores will remain the foundation of the shopping experience. Occupancy rates of the retail REITs were as high as 96.3 percent in late 2014, and may well be near there again next year.

Industrial markets
E-commerce has been a strong wind at the back of the industrial sector due to the need for logistics facilities to ship goods purchased online. Net absorption doubled from 2011 to 2016, to 237 million sq ft, according to CoStar, before slowing a bit in 2017.
Will demand for industrial space (a) decline in 2018 (I see this as the least likely outcome, with a 10 percent chance); (b) increase, but remain below the 2016 mark (70 percent probability); (c) move to a new high above 237 million sq ft (20 percent odds)?
E-commerce is not going away and its appetite for logistics space is unlikely to diminish, and may reach a new high water mark.
Property prices
Commercial property prices have risen 52 percent over the past five years, and are 23 percent above the peak reached prior to the financial crisis, according to the CoStar Commercial Repeat Sales Index (CCRSI). Price gains have slowed to 4.5 percent over the past twelve months, alleviating some of the concerns about possible overheating.
In 2018, will the CCRSI (a) decline (10 percent odds); (b) rise by less than 5 percent (most likely, at 70 percent odds; (c) rise more than 5 percent (20 percent odds).
It would not be unusual for prices to give back some of the large gains they have made over the past five years, especially if interest rates were to rise more rapidly than expected. Conditions in property markets are solid, however, with low vacancy rates, a rough balance between new supply and the demand for commercial space, continued rent growth and some acceleration in NOI growth. Indeed, Real Capital Analytics recently reported that cap rates in the apartment, office and industrial sectors declined in October to the lowest levels since at least 2001. Single-digit gains in prices are most likely in this environment.