By Calvin Schnure, SVP, Research & Economic Analysis, NAREIT
October 2017
Commercial real estate has gone through many boom/bust cycles in the past. These cycles have inevitably affected the performance of REITs through their impact on rents, vacancy rates and property valuations. There are certain features that are common to nearly all these cycles, including overbuilding and a relaxation of risk standards by builders, lenders and investors. There are also differences across these cycles, however, much as Tolstoy wrote in Anna Karenina, “each unhappy family is unhappy in its own way.”
Let’s take a deeper look at past cycles in commercial real estate, in order to put current market conditions into a historical context. Certain features of the current cycle have raised concerns, including the length of the cycle, the steady increase in construction and sustained rise in property prices. Other parts of the picture, however, do not fit with a sector being in danger of overheating. These factors include a level of construction that is well below average in relation to increases in overall GDP, as well as modest debt growth and a muted rise in overall leverage.
Commercial construction is highly cyclical
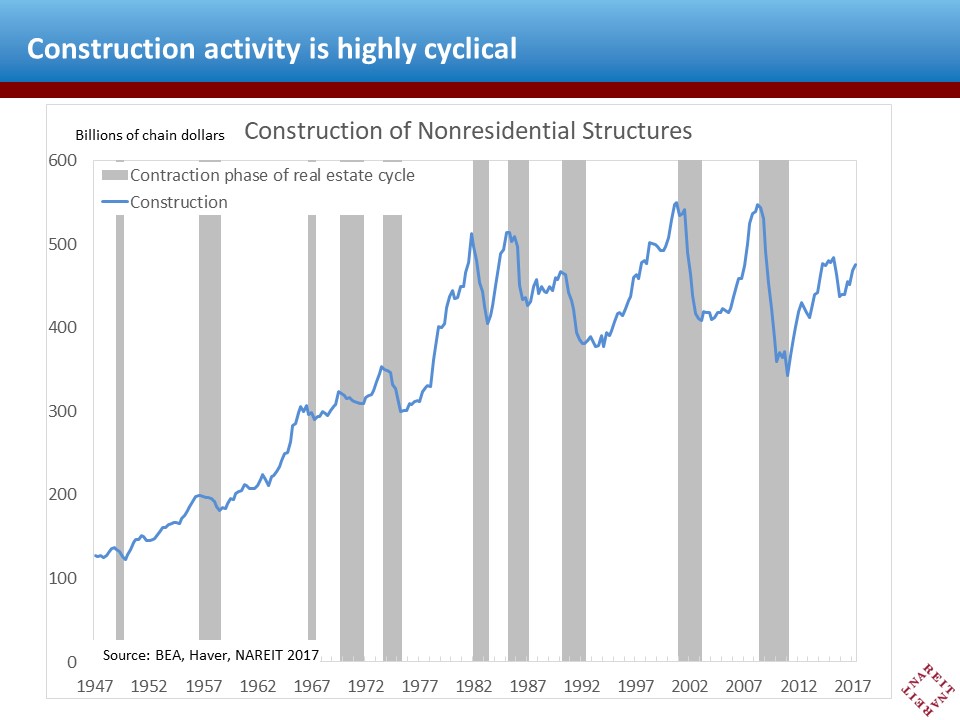
Commercial construction activity is one of the most highly cyclical parts of the economy. There have been seven periods since the end of World War II where real construction fell 10 percent or more from a cyclical peak, as well as three other downturns with somewhat shallower declines (chart above). Construction rose about 40 percent during a typical boom, with larger increases during the longer expansions in the 1960s and 1970s (chart below). The average length of boom cycles during the post-war period has been slightly less than five years (table). (See here for an earlier analysis of the cyclical aspects of the U.S. economy.)
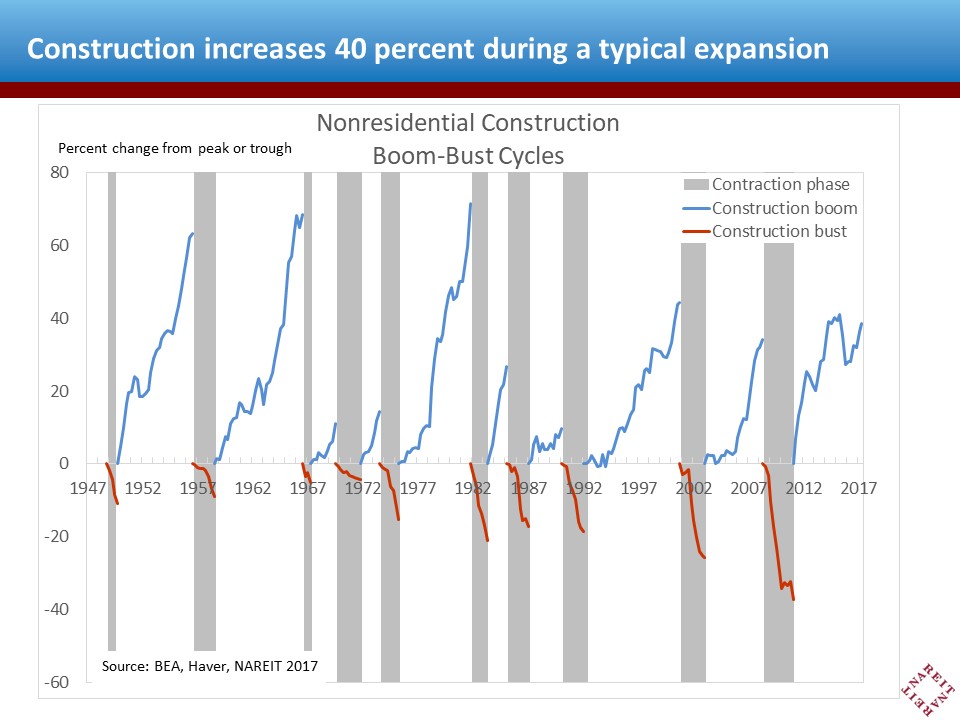
The bust cycles following these booms have been shorter, but the declines in construction were steep. The average construction downturn lasted less than two years before reaching bottom, but real construction activity declined 16 percent, on average, during these short periods. Construction as a share of GDP increased to 4.0 percent at the average peak of the construction cycles, and bottomed out at an average of 3.3 percent of GDP.
Downturns in real estate cycles often coincide with recessions in the macro economy, but there have been exceptions. Construction reached its highest share relative to GDP in the early 1980s, and the resulting glut of commercial properties, especially office buildings, led to a 17 percent plunge in construction between 1985 and 1987, even as the overall economy continued to expand. Conversely, the recessions of 1953-4 and 1960 were not accompanied by a decline in construction activity.
The current expansion in construction has continued for over six years, and is already longer than the average postwar boom. Real construction activity has increase 38.5 percent from its low point in 2011, matching the average over the prior cycles. In terms of calendar length and the increase in activity, the current cycle is looking rather mature.
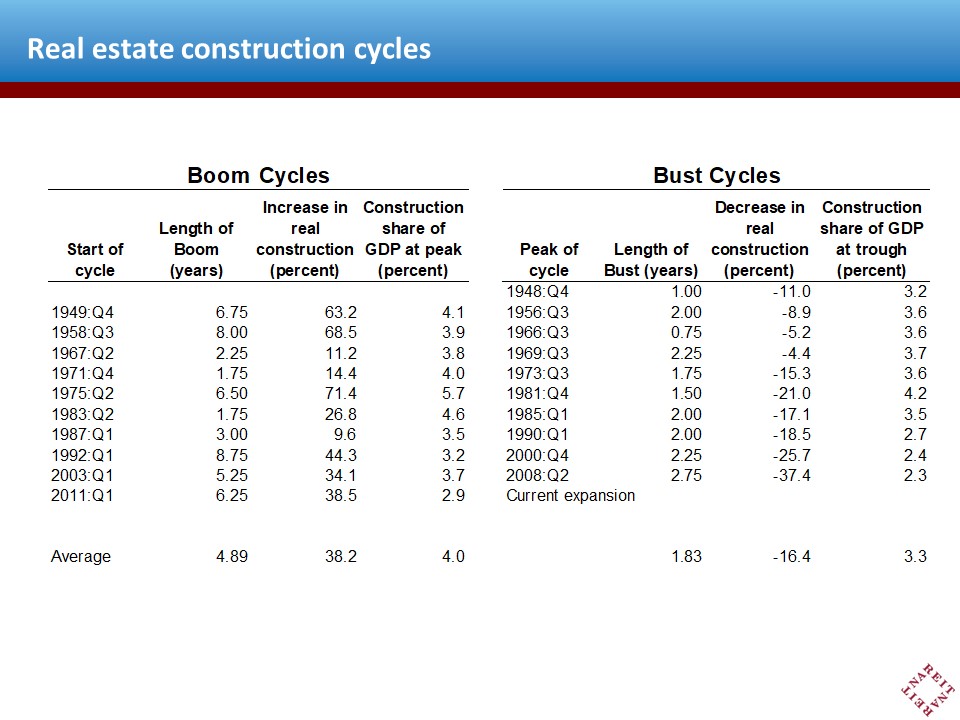
The length of the expansion and the increase from the trough, however, mainly reflect the low point reached in the aftermath of the financial crisis. Indeed, construction dropped to 2.3 percent of GDP in 2011, which is the lowest point since 1947 (far right column of table above). From this perspective, the current expansion does not look overdone. In fact, construction as a share of GDP as of 2017:Q2 has risen only to 2.9 percent, which is still below the average low point reached in prior bust cycles. This suggests that construction would need to increase quite a bit more for national markets to be overbuilt. Local markets may experience a glut as projects are completed, but experience shows that modest local surpluses tend to be absorbed before long.
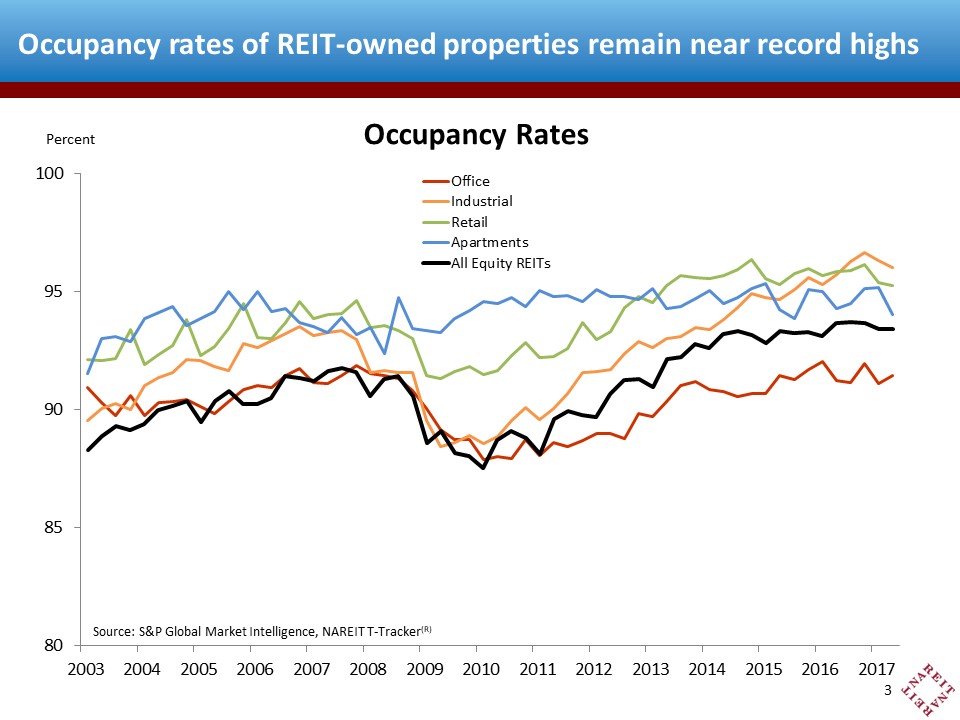
Conditions in REIT property portfolios show few if any signs of excess supply. When construction gets ahead of demand for commercial space, occupancy rates fall and vacancy rates rise. Occupancy rates of REIT-owned properties, however, remain near the record highs set last year (chart above; for data on occupancy rates and other measures of operating performance of REITs, visit the T-Tracker®.)
Construction by property types
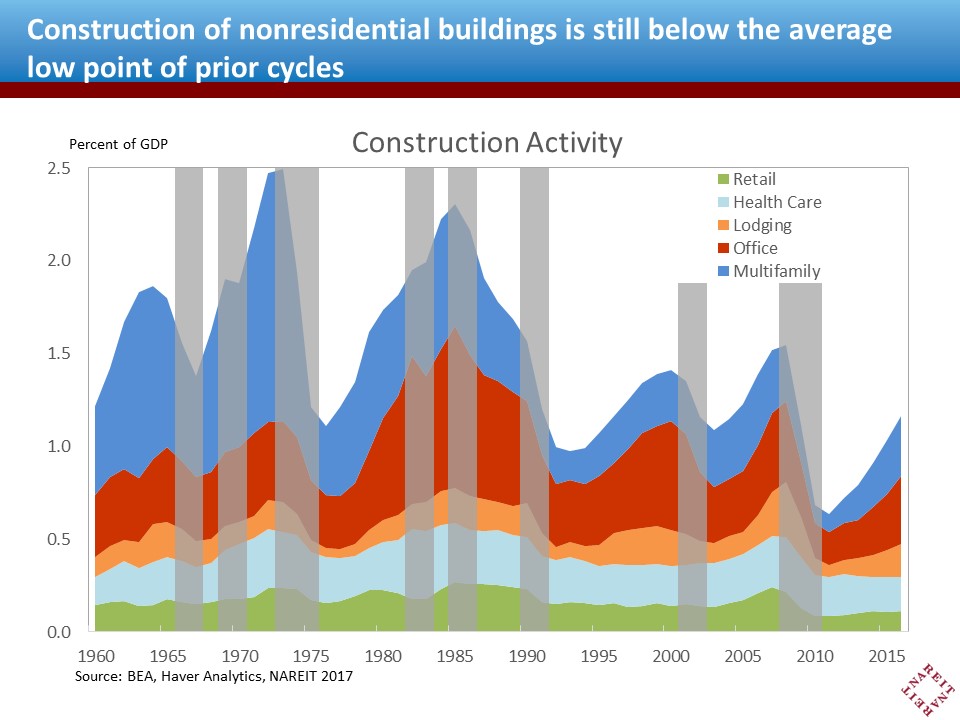
Construction trends can be quite different across the types of properties, and the aggregate figures on construction activity examined above do not reveal these details. Information on construction activity by certain property types is more limited compared to the data for total construction, with annual data available since 1960 (chart above).
No property type is completely immune from the broad macro trends, and the peaks and valleys in construction of office, retail, lodging, health care and multifamily properties follow a similar historical pattern over the past half-century. A few episodes do stand out for specific property types, however. The entry of the Baby Boom generation into the apartment markets caused a surge in multifamily construction in the 1970s and 1980s (blue area). Also, the speculative boom in office construction in the 1980s is clearly visible (red area).
We can to turn to a different data source for more high frequency data through the middle of this year. Chart 5 displays construction put-in-place as a percent of GDP (construction put-in-place, published by the Census Bureau, is the primary source for the construction data in GDP shown in the earlier charts. Construction put-in-place data are available through August 2017 as of this writing).
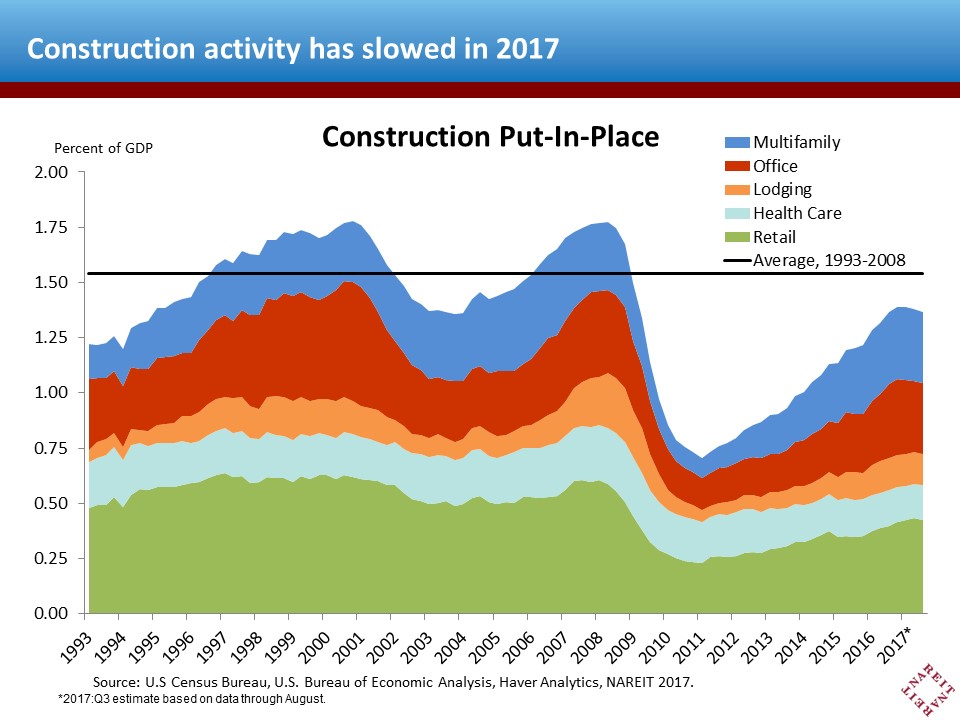
The news so far this year has been surprising, as construction activity has turned down in recent months, both in terms of absolute dollars spent and also as a percentage of GDP (chart above). Construction in August was 2.6 percent lower than at the end of 2016, and construction has slowed among office, retail, lodging, health care and multifamily properties. It is unusual to see a deceleration of this magnitude when the economy is still expanding and when the construction share of GDP is below its long-run average.
One possible explanation for the pullback is that developers have become more cautious about starting new projects. An interesting possibility has been suggested by Tim Riddiough, whose research indicates that the growing presence of listed REITs in commercial real estate markets has had a “civilizing influence” on development cycles to the extent that a greater role of publicly listed real estate firms encourages the use of market information in investment decisions. Specifically, the share prices of listed REITs can serve as a signal about future conditions in commercial real estate markets, according to Riddiough, helping damp speculative boom cycles compared to those that occurred in the past. Indeed, construction as a share of GDP (third column of the table above) topped out at successively lower peaks as the REIT industry grew, consistent with there being such a civilizing influence on speculative building. (See, Securitization and the Supply Cycle: Evidence from the REIT Market, Journal of Portfolio Management 2013, vol. 39 no. 5.)
The downshift in construction activity will lead to a lower level of new supply in the years ahead. This is favorable news for investors in commercial real estate, including REITs, as it reduces the risks of a supply glut and may well extend the expansion, and rising rents and property prices, even further.
Debt and leverage are subdued
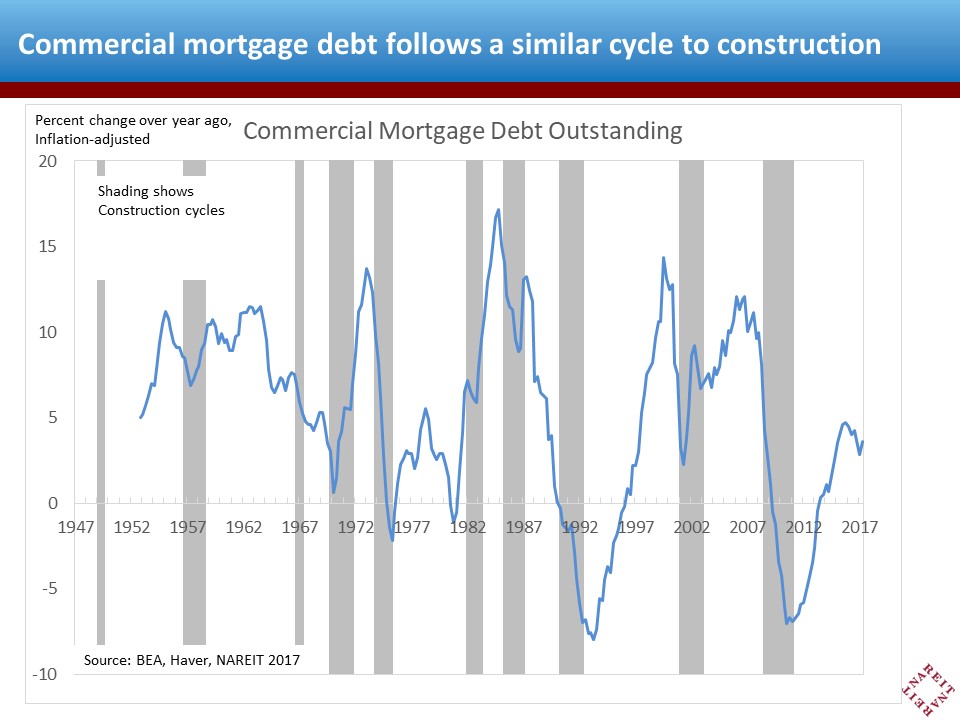
Commercial mortgage debt and construction activity often go hand-in-hand. Debt finance is important to support construction and investment, but excessive lending can contribute to overheating. Cycles in the growth of real commercial mortgage debt outstanding line up reasonably closely with the construction boom-bust cycles identified above (chart above). Debt growth peaked at or near the top of each construction cycle, and slowed or turned negative during the construction bust. Debt grew at a double-digit pace during most prior expansions, including the years prior to the financial crisis a decade ago. Periods with decreasing mortgage debt outstanding, in contrast, reflect both deleveraging and paying down debt, but also defaults on commercial mortgages.
It is noteworthy that the declines in commercial mortgage debt outstanding were deeper and longer-lasting in 1990-1995 than during 2009-2013. This reflects the severity of the capital crisis in commercial real estate in the early 1990s which, among other effects, led to the creation of a new generation of REITs to raise capital for the sector (i.e. the beginning of the Modern REIT Era). It is also a reminder that the financial crisis in 2008-09 originated in subprime residential mortgages, not commercial property markets.
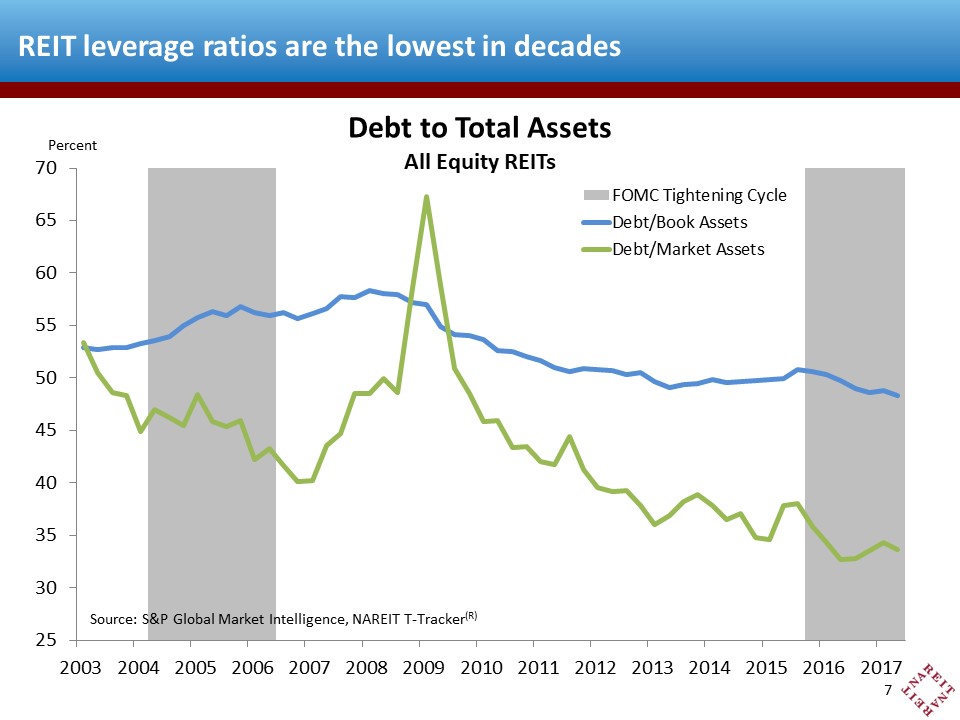
Growth of commercial mortgage debt over the past five years has been the slowest of any real estate expansion over the 65 years for which we have data. In fact, real commercial mortgage debt outstanding is more than 7 percent below the peak at the end of 2008. Property prices, meanwhile, are well above their pre-crisis peaks, even after adjusting for inflation. Higher prices and lower debt by definition means a reduction in aggregate leverage in the commercial real estate sector. REITs, in particular, have solidified their balance sheets in recent years, reducing both book- and market-value leverage ratios to the lowest in decades (chart above). (See a recent Market Commentary by NAREIT researcher Alexandra Thompson on recent developments in commercial mortgage markets.)
Lessons from past cycles for the outlook today
The most important lesson from this study of past commercial construction cycles is not what the average experience looks like, but the wide range of conditions across real estate cycles. The length of past cycles has been anything but uniform, with the longest past cycle persisting for nearly nine years, and several other cycles lasting three years or less before being interrupted by outside factors like a macroeconomic recession, or oil embargo and oil shock. Similarly, the rise in inflation-adjusted construction spending to date of nearly 40 percent may be comparable to the average expansion over the past 70 years, but this is barely half the increase that occurred during the robust boom in the late 1970s.
The current cycle will likely be remembered years from now as being different from prior cycles in nearly every way. It has been slow to gain momentum, and has become “long in the tooth” in calendar time before it has even reached mid-cycle stature in terms of construction as a share of GDP. There are, however, three lessons from these past cycles that are relevant today:
- First, overbuilding is a typical late-cycle feature. In terms of national activity across the main property markets, however, today’s construction cycle has still not advanced far enough from the record lows during the trough after the financial crisis to be in a danger zone;
- Second, rapid debt growth and high leverage can weaken the financial strength of real estate investors, and can fuel speculative activity that depends upon future demand that may or may not materialize. Debt growth has been slower this cycle than in the past, however, perhaps as lenders are cautious due to memories of the financial crisis or concerns about the strength of the macro economy;
- Third, many previous cycles ended rather suddenly due to surprises from within the real estate sector, elsewhere in the U.S. economy or perhaps developments abroad.
While the first and second lessons give some comfort for the outlook, the third is a reminder of our limited ability to anticipate the future. With the macro economy still in expansion mode and no obvious signs of excesses in overbuilding or debt, we remain cautiously optimistic about the outlook for REITs and real estate.