As property transactions return, REITs’ solid balance sheets could give them meaningful advantages in acquisitions and growth over private real estate.

2024 REIT Outlook
2024 REIT Market Outlook: Recovery Could Be On the Horizon
Key Takeaways
- With the Federal Reserve at, or near, the end of its tightening cycle, REITs are well-situated for outsized performance in 2024.
- The gap between REIT implied and private appraisal-based cap rates will likely close or converge in 2024.
- While public real estate valuations have adjusted, private real estate valuations probably will see further declines in 2024.
- REITs’ well-managed balance sheets likely will enable them to navigate economic uncertainty in 2024.
- As property transactions return, REITs’ solid balance sheets could give them meaningful advantages in acquisitions and growth over private real estate.
Economic uncertainty, which began in 2022 and created a difficult environment for REIT share prices, will likely be an ongoing theme in 2024. For example, as the 10-year Treasury yield increased nearly 3% and REIT implied cap rates rose from 4.5% to nearly 6.5%, REIT share prices fell by 21.4% from the beginning of 2022 through Dec. 1, 2023.
Yet, there are three hopeful signs for a meaningful REIT recovery in 2024 and beyond:
- REITs have typically enjoyed strong absolute and relative total return performances after monetary policy tightening cycles end.
- The valuation divergence between REITs and private real estate will likely converge in 2024, making REITs an attractive option for investors.
- Solid balance sheets will enable REITs to navigate ongoing economic uncertainty while providing an advantage in terms of acquisitions and growth.
REITs Often Outperform After Fed Tightening Cycles End
Rising interest rates have created headwinds for the financial and real estate markets. Compared to private real estate and equities, REITs have borne the brunt of the valuation declines. With the Federal Reserve at or near the end of its interest rate hike cycle, looking at how public real estate, private real estate, and equity markets performed after previous Fed tightening cycles can offer an informed outlook for how those markets could perform in 2024.
Notably, Fed tightening cycles typically mark inflection points in the economy and financial markets, and each of the monetary policy tightening cycles since 1990 had a unique backdrop.
- The 1994–1995 cycle was a rare occasion where the Fed was able to execute a “soft landing” after several years of strong economic growth.
- The 1999–2000 and 2005–2006 interest rate hike cycles were related to the dotcom and housing booms, respectively.
- The 2015–2018 cycle was implemented to return to normalcy after the significant rate cuts stemming from the global financial crisis (GFC).
- The 2022–2023 cycle has been a move against accelerating inflation.
Of the five cycles, the first four are considered full cycles. The current tightening cycle may not be complete because there is still the possibility of another rate hike before 2023 ends.

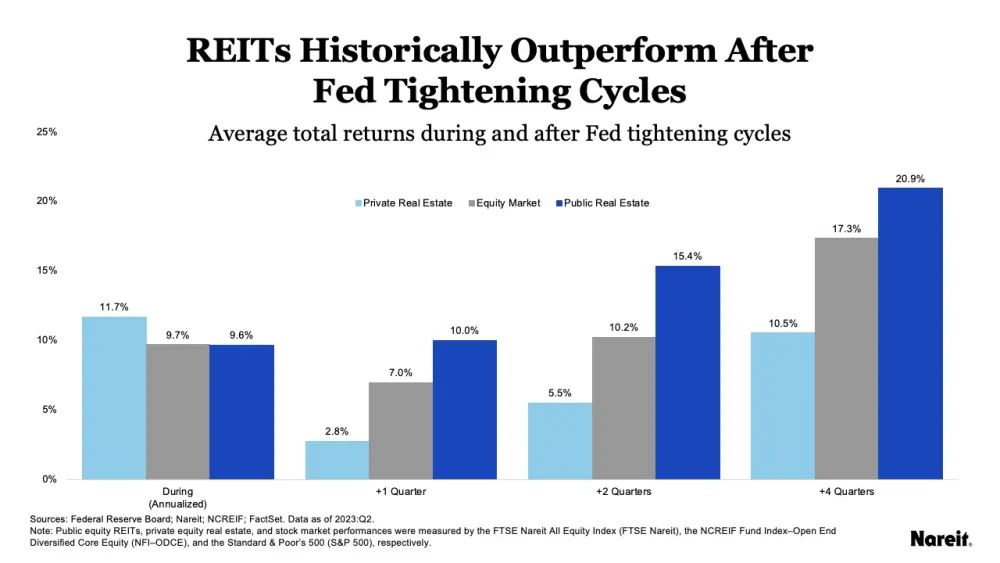
The chart above displays average total returns for public and private real estate, and the equity market, both during monetary policy tightening cycles and after they end. The analysis includes the four full rate hike cycles that occurred since the first quarter of 1990.
The chart shows that, on average, REITs experienced relative total return underperformance during the Fed’s tightening cycles. In contrast, REITs outperformed both private real estate and equities across each of the post-cycle time horizons. Further review reveals a distinct pecking order: REIT total returns were the highest, followed by equity returns, and then private real estate returns. Average four-quarter post-cycle total returns for the FTSE Nareit All Equity Index (FTSE Nareit) and the S&P 500 were also significantly higher than their average annualized total returns during the cycles.
Though past performance may not be indicative of future results, public equity REITs have historically enjoyed a resurgence in total return performance after monetary policy tightening cycles end. For example, as the Fed held rates steady for the second consecutive time at its October/November meeting, REITs enjoyed a bounce in performance; from Oct. 31–Dec. 1 FTSE Nareit total returns were up 14.5%. With the Fed at or near the end of its set of rate hikes, REITs appear to be well situated for outsized performance.
Public equity REITs have historically enjoyed a resurgence in total return performance after monetary policy tightening cycles end.
Valuation Convergence Could Make REITs More Attractive
There has been a divergence between U.S. public and private real estate valuations over the past two years, but that gap will likely close in 2024, which could make REITs an extremely attractive option for investors.
This valuation divergence can be captured via differences in capitalization (cap) rates. Today, public real estate cap rates remain materially higher than their private counterparts. Despite surges in the 10-year Treasury yield and property debt rates, and corresponding material increases in REIT implied and private transaction cap rates, private appraisal cap rates have only increased slightly. Private real estate investors may find comfort in the modest increases in appraisal cap rates—and the modest declines in appraised property values—but these adjustments provide a false sense of security as they fail to reflect market realities.
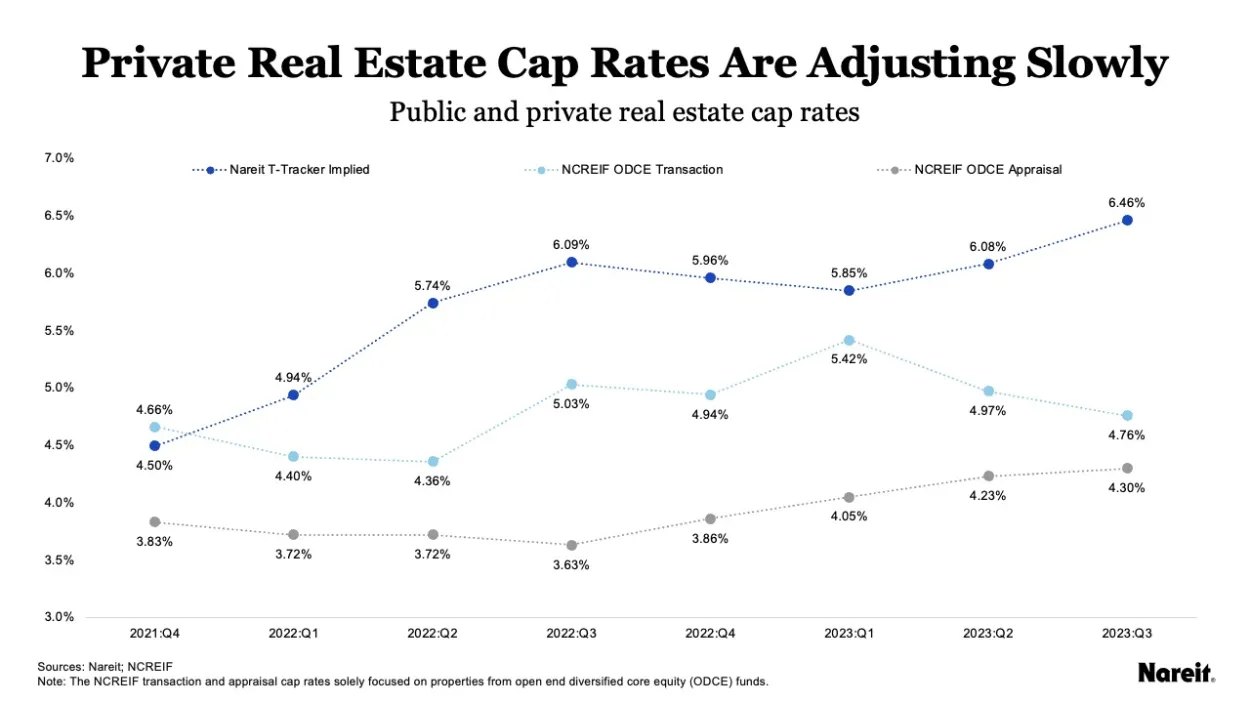
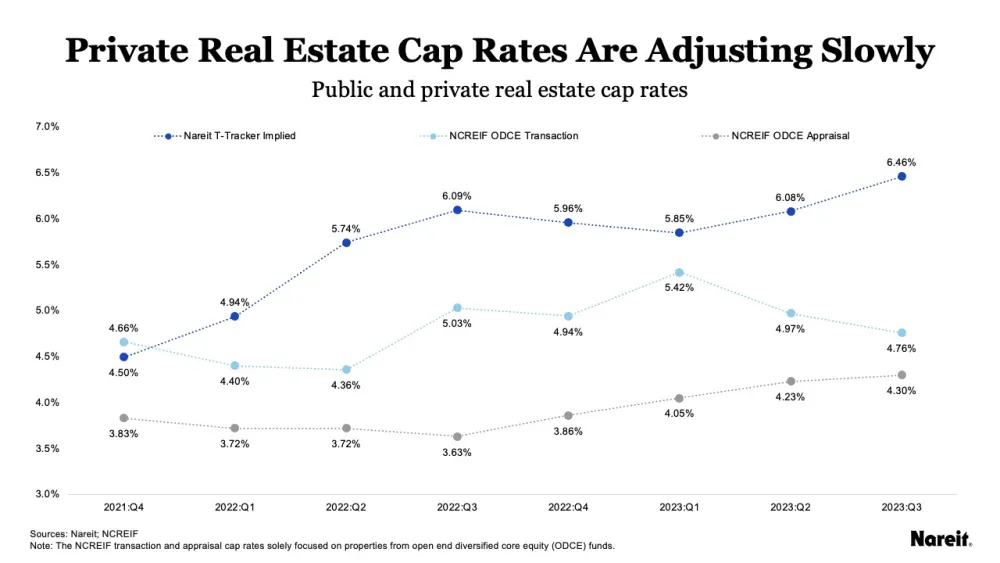
Data from the Nareit Total REIT Industry Tracker Series, or T-Tracker®, and the National Council of Real Estate Investment Fiduciaries (NCREIF) demonstrate the progress of the property valuation adjustment process. The chart above displays public (REIT implied) and private (transaction and appraisal) real estate cap rates from the fourth quarter of 2021 to the second quarter of 2023.
The chart shows that the valuation adjustment process has been slow. The REIT implied cap rate has maintained a consistent level over the last four quarters, staying close to or above 6%. The gap between the REIT implied and the NCREIF open end diversified core equity (ODCE) transaction cap rates has been attempting to close, but the private transaction cap rate has been a fickle metric because of the lack of transactions. During 2023, the volume of quarterly ODCE transaction market values averaged less than 0.5% of ODCE appraised values. The private appraisal cap rate has experienced measured—and possibly managed—increases since the third quarter of 2022; these token gestures averaged less than 20 basis points (bps) per quarter.
With the Fed at or near the end of its set of rate hikes, REITs appear to be well situated for outsized performance.
The modest increases in appraisal cap rates have acknowledged the property valuation problem. However, they have failed to address its severity and come with substantial costs, including impeding the market’s price discovery process, limiting transaction market liquidity, and obliging investors to pay artificially high investment management fees.
Possible Further Write-Downs of Private Real Estate Valuations
As of third quarter 2023, the REIT implied and appraisal cap rate spread has remained wide as property appraisals have been slow to adjust to current market conditions. For example:
- The REIT implied and private transaction-based cap rate spread was 170 bps.
- The REIT implied and private appraisal-based cap rate spread was 216 bps.
These great divides indicate serious disparities between today’s public and private real estate valuations. The potential valuation impacts associated with transaction and appraisal cap rates moving to the REIT implied cap rate are significant. All else equal, closing the REIT implied–transaction gap would require private value write-downs of more than 25%; the declines would need to exceed 30% to eliminate the REIT-implied appraisal spread. Though these valuation adjustments represent extreme scenarios, significant rises in transaction and appraisal cap rates are warranted and further material write-downs are likely on the horizon for the private real estate market.
The preceding analyses of private and public real estate cap rates portend that the REIT implied and private cap rates will likely close, or converge, in 2024. As a result, the private real estate value declines associated with this convergence will likely increase REITs’ attractiveness because they will more accurately reflect current market valuations.
Disciplined REIT Balance Sheets Offer Competitive Advantage
The commercial real estate mortgage market has been marked by higher interest rates and stricter underwriting standards. U.S. public equity REITs have not been immune from the current mortgage market turmoil, but data from Nareit’s T-Tracker for the third quarter of 2023 show that they have limited their exposure to these challenges by maintaining low leverage ratios and focusing on fixed rate and unsecured debt. The average REIT leverage ratio in the third quarter was around 36%. REIT balance sheet strength and access to capital markets may position them well to make more acquisitions as property transaction volume increases in 2024.
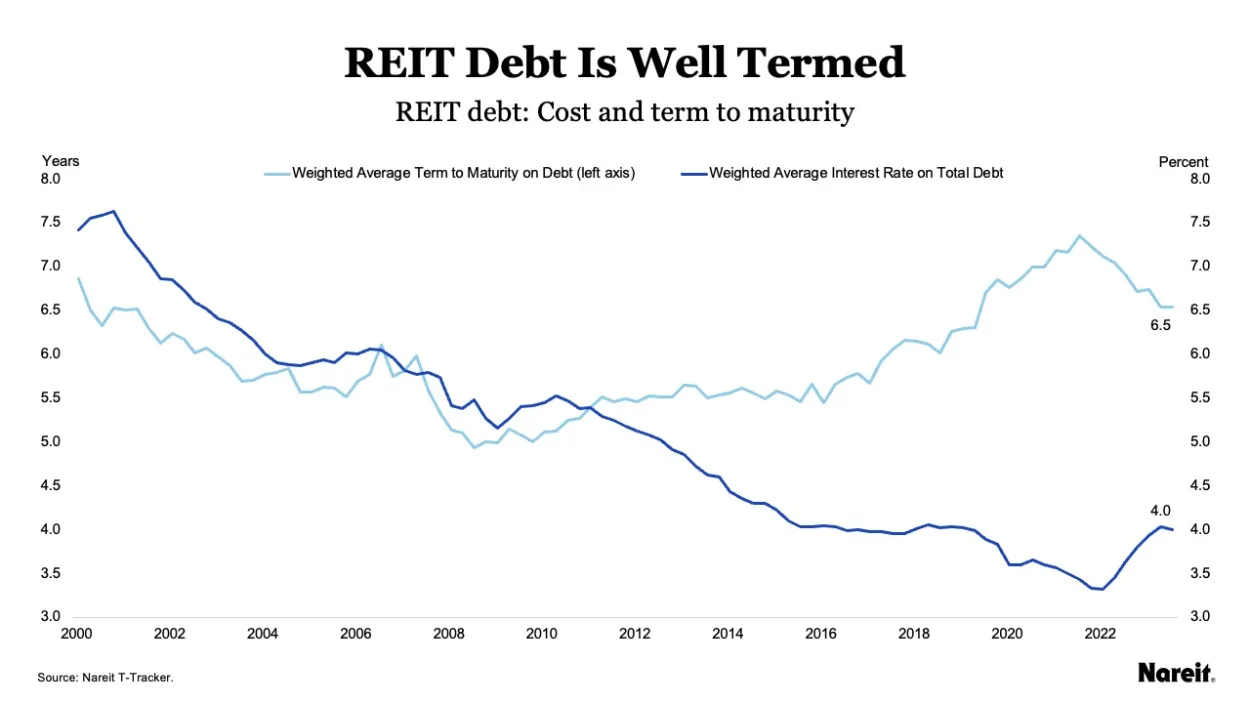
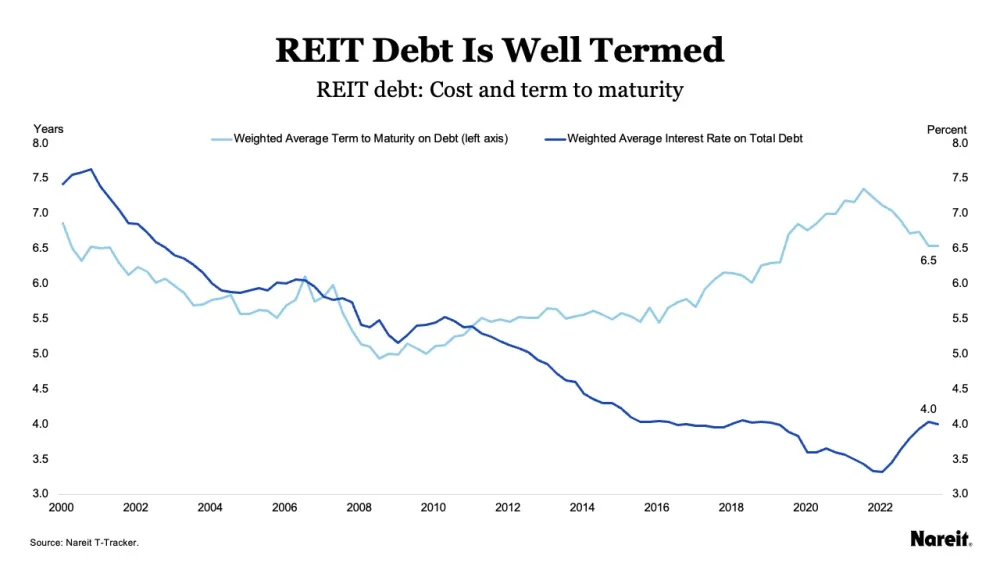
The chart above shows the weighted average terms to maturity and interest rates on total debt for U.S. public equity REITs from the first quarter of 2000 to the third quarter of 2023. The equity REIT weighted average term to maturity has generally increased since the GFC: it is now 6.5 years. These lengthy maturity terms mean REITs haven’t needed to refinance as much, and in turn, their distributable cash flows haven’t been as stressed by the high interest rate environment.
Further analysis and comparison to the 10-year Treasury show that REIT debt costs have only increased marginally. From the fourth quarter of 2021 to the third quarter of 2023, the U.S. 10-year Treasury yield increased by 262 bps to 4.2%. Meanwhile, the public equity REIT weighted average interest rate on total debt rose by 67 bps to 4.0%.
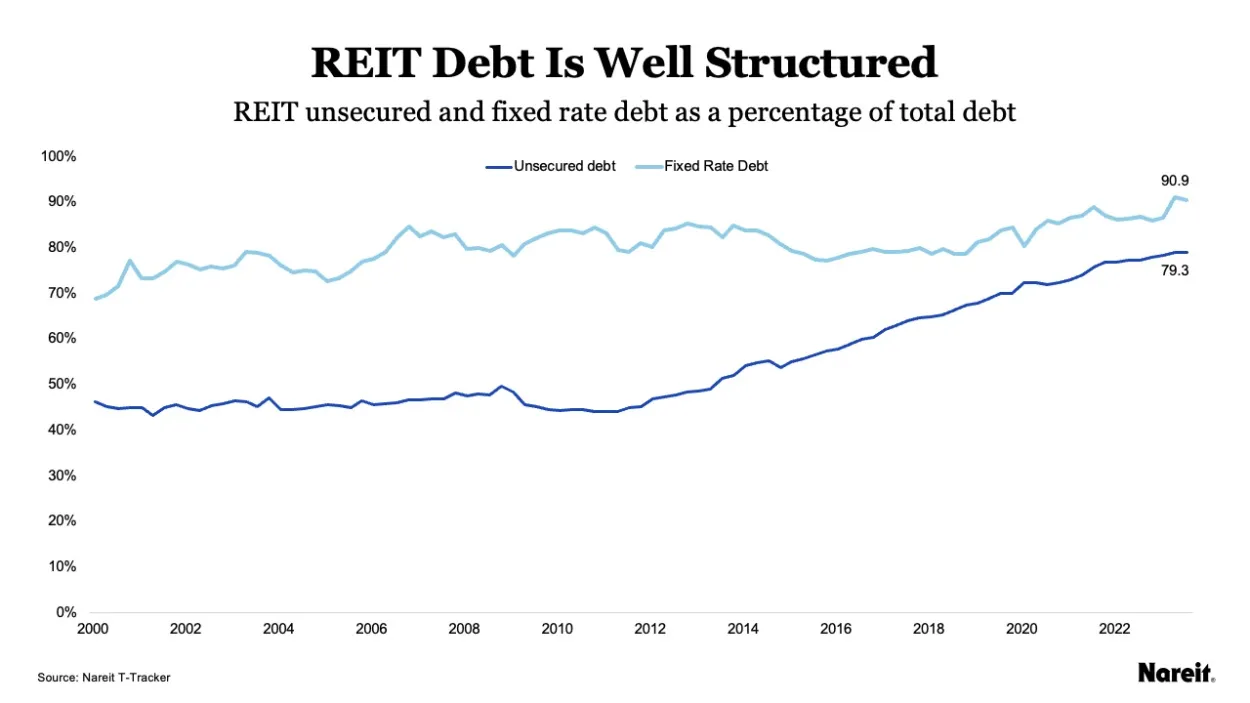
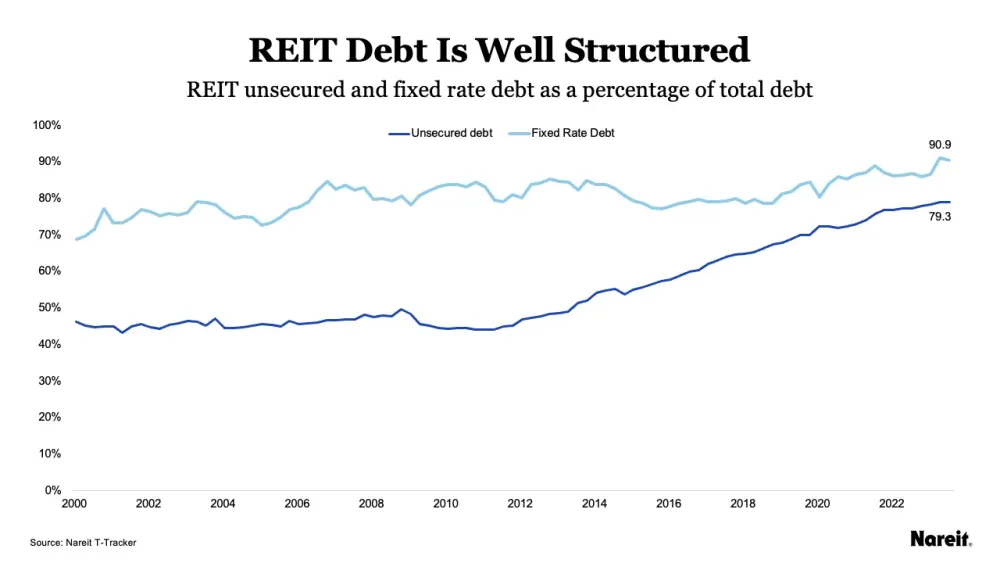
The chart above presents fixed rate and unsecured debt as percentages of total debt for U.S. public equity REITs from the first quarter of 2000 to the third quarter of 2023. The takeaway is clear: over time, REITs notably increased their fixed rate and unsecured debt. On average, the percentage of total debt at a fixed rate for U.S. public equity REITs was 90.9%. This commitment to fixed rate debt highlights REITs’ long-term investment perspective.
REITs’ use of unsecured debt has also grown consistently since 2013, reaching 79.3% of total debt in the third quarter of 2023. In addition, nine of the 13 REIT property sectors had unsecured-to-total debt percentages greater than 75% in the third quarter of 2023. This is unsurprising, given that more than 85% of public equity REITs have an investment grade bond rating.
With low leverage policies focused on fixed rate and unsecured debt with longer-term maturities, REITs’ balance sheets are helping the sector handle tighter credit conditions and higher interest rates. These disciplined balance sheets have also made REITs well-prepared for market uncertainty while paving the way for potential opportunistic real estate acquisitions.
REITs Could Offer Investment Opportunities in 2024
Looking to 2024 and beyond, it’s clear that potential total return outperformance, attractive pricing with converging valuations, and solid balance sheets likely will increase the appeal of REITs and offer investors tactical and strategic investment opportunities.
Though 2022 and 2023 were challenging years for REITs, the recovery is likely on the horizon.

Edward F. Pierzak is senior vice president of research at Nareit where his primary responsibility is contributing to Nareit's commercial real estate and macroeconomic analysis. He also builds and strengthens relationships with public, private, and academic organizations.