Nareit tracks quarterly investment holdings for the largest actively managed real estate investment funds focusing on REIT investment for insights into expert investor sentiment. In the first quarter of 2026, data centers saw the largest quarterly and yearly increases of all the property sectors, bringing it to 139% of its index weight in the funds. In contrast, residential saw the largest quarter-over-quarter and year-over-year declines, respectively, leaving it underweight at 97% of its index share.
Health care maintained its top spot in the funds at 19.4% of assets under management, followed closely by data centers (18.5%) and retail (13.6%). Telecommunications fell to 12.2%, while residential dropped to 10.9%. Gaming continued its decline of share in the funds, dropping to just 1.3% of assets, the third smallest allocation after diversified.
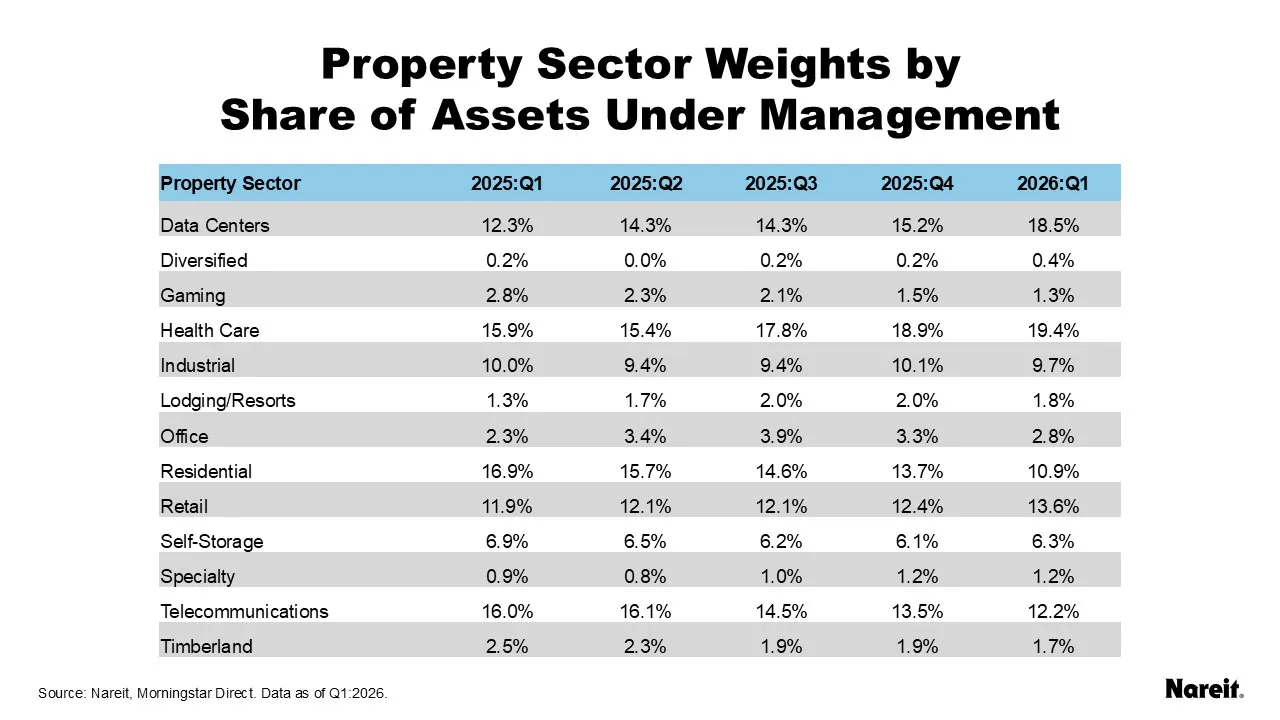
The table above shows the share of each equity REIT property sector by assets under management.
- Health care (19.4%), data centers (18.5%), and retail (13.6%) now represent the three largest allocations.
- Telecommunications (12.2%) and residential (10.9%) follow to claim the fourth and fifth spots, respectively.
- Office (2.8%), lodging/resorts (1.8%), timberland (1.7%), gaming (1.3%), and specialty (1.2%) represent smaller allocations.
- Diversified, though at its largest allocation since the first quarter of 2024, continues to rank last at 0.4%.
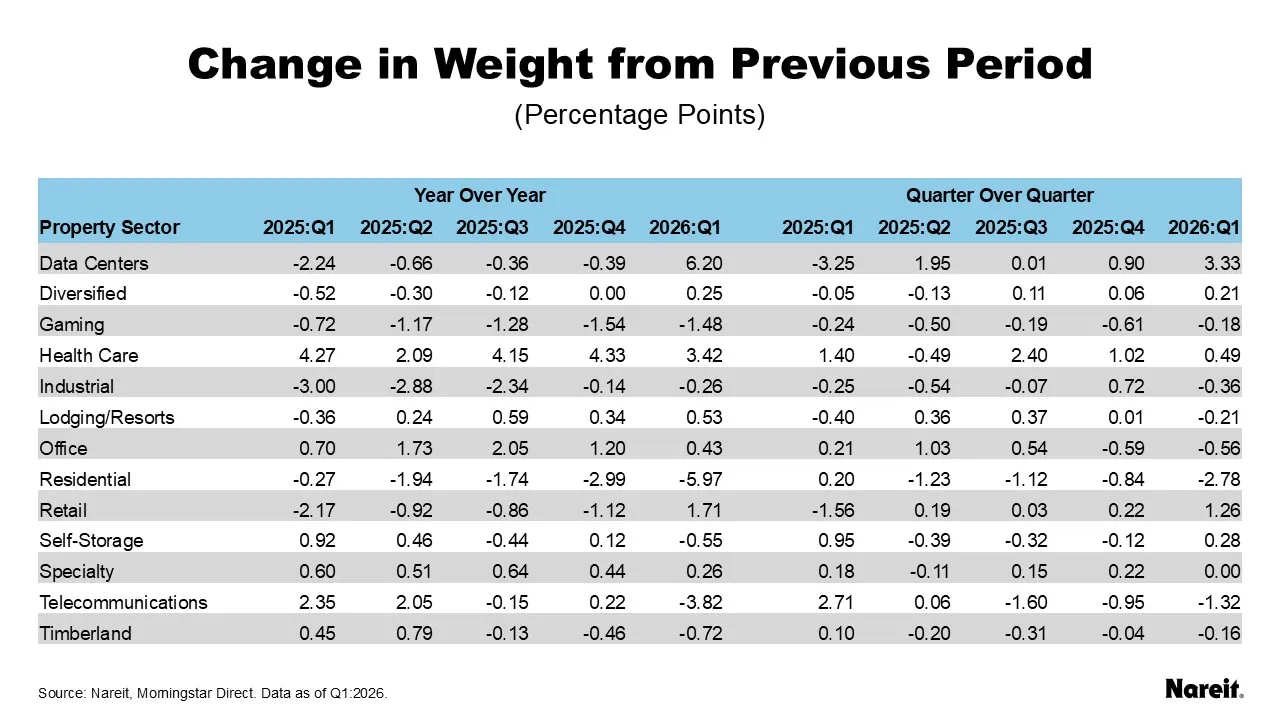
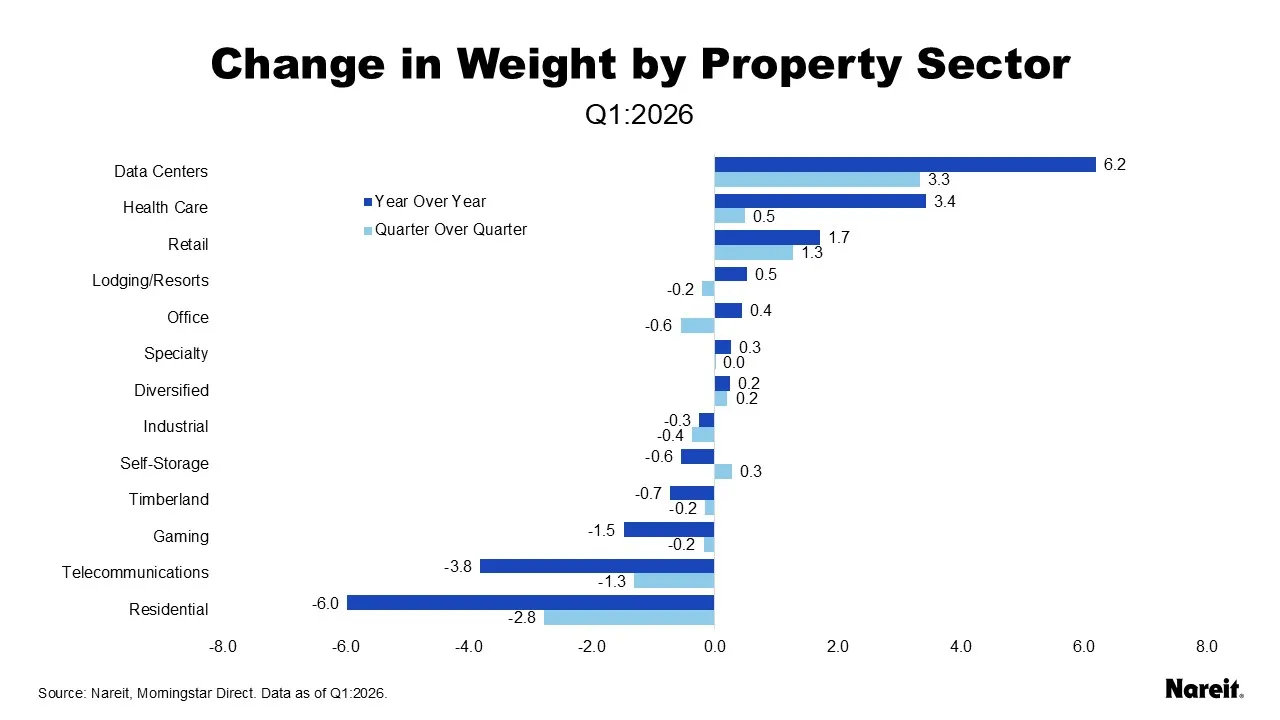
The table and chart above show the change in property sector asset share by quarter and from the previous year.
- Data centers saw the largest quarterly increase at 3.3 percentage points, as well as the largest yearly increase at 6.2 percentage points.
- Retail and health care also had both quarter-over-quarter and year-over-year increases. Retail was up 1.3 percentage points since the last quarter and up 1.7 percentage points since last year. Health care had a 0.5 percentage point quarter-over-quarter increase and a 3.4 percentage point year-over-year increase.
- Lodging/resorts and office had annual gains but quarterly decreases in weight. Lodging/resorts saw an annual gain of 0.5 percentage points but was down 0.2 percentage points over last quarter. Similarly, office saw an annual gain of 0.4 percentage points but was down 0.6 percentage points over last quarter.
- Gaming, telecommunications, and residential saw the largest declines both quarterly and annually, respectively.
- Gaming extended its multi-quarter downtrend (down 0.2 percentage points quarter-over- quarter and down 1.5 percentage points year-over-year).
- Telecommunications fell significantly (down 1.3 percentage points quarter-over-quarter and down 3.8 percentage points year-over-year).
- Residential posted the largest declines (down 2.8 percentage points quarter-over- quarter and down 6.0 percentage points year-over-year).
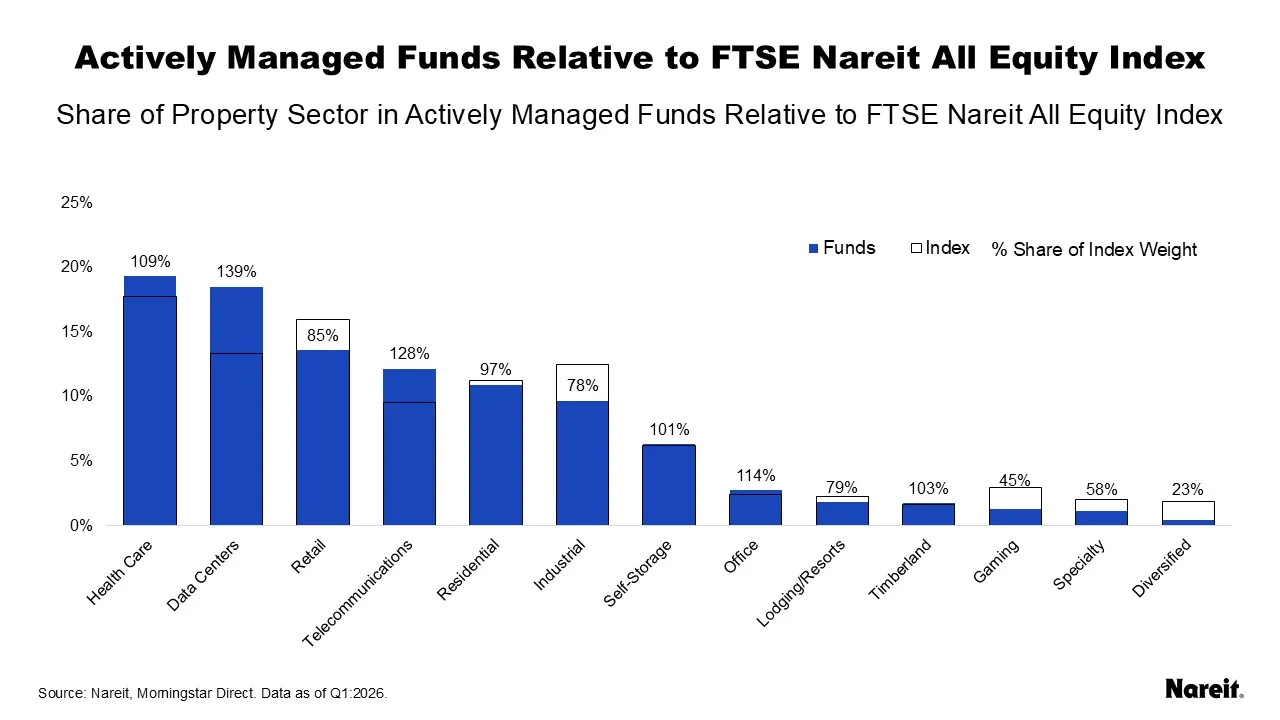
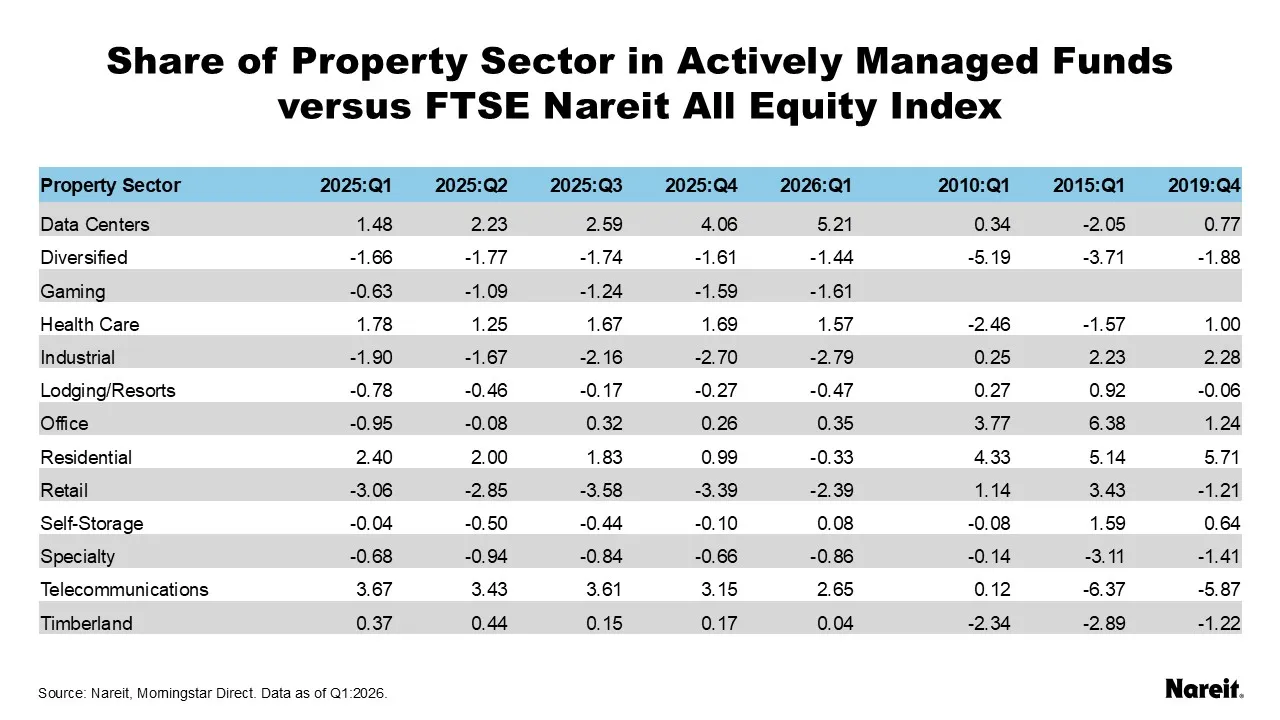
The chart and table above compare the weight of the sectors in actively managed funds to the weight of the sectors in the FTSE Nareit All Equity index. Relative to the index:
- Data centers have overtaken telecommunications as the most overweight sector by both percentage points and index share, overweight in the index by 5.2 percentage points and 139% of its index share.
- Telecommunications remains overweight at 2.6 percentage points, 128% of its index weight.
- Health care (109% of its index share) and office (114% of its index share) were overweight this quarter.
- Self-storage sits close to parity at 101% of its index share this quarter.
- Residential, which was overweight last quarter, is now slightly underweight by 0.3 percentage points, 97% of its index share.
- Retail and industrial remained as the most underweight sectors, with retail over 2 percentage points underweight (85% of its index share) and industrial nearly 3 percentage points underweight (78% of its index share).
- Gaming continued to show a decline in share. The sector is 45% of its index share.
- Specialty (58% of its index share) and diversified (23% of its index share) also remain below their respective index weights.
Note that two of the 24 funds had not reported first quarter data for this analysis.
For more information on the active manager project, see Reading the Real Estate Market: Tracking Active Managers’ Allocations Over Time.