Key Takeaways
- REITs delivered strong investment performance through mid-year 2026, outperforming the broad equity market by a sizable margin. This performance reversed their 2025 trend and showed that REITs can do well in an elevated and rising interest rate environment.
- Despite economic uncertainties, REITs delivered solid operational performance and maintained disciplined balance sheets, which will help with future REIT performance and growth opportunities.
- As the tech rally lost steam and REITs posted strong total returns, the divergence between broader equity and REIT valuation multiples started to converge. Further narrowing will likely drive continued REIT relative outperformance.
- With private appraised property values continuing to lag the market, the public-private real estate valuation divergence continues to linger. As appraised values are marked to market, REITs will likely enjoy relative outperformance.
- The REIT sector has experienced significant merger and acquisition (M&A) activity. Privatizations have attracted media attention, but the most significant capital shifts have been strategic consolidations between public-listed REITs.
REIT Relative Outperformance Continues
REITs began 2026 with a strong start, outperforming broad equities by a sizable margin, which was reminiscent of 2025. While the introduction of new tariff policies derailed early REIT relative outperformance last year, this year’s conflict with Iran has not.
Barring unexpected shocks, historical data show that in years when REITs realized early strong relative outperformance, they have typically been able finish the year besting the broad equity market. In three (2006, 2011, and 2014) of the four full calendar years from 2006 to 2025, when REITs posted their largest outperformance numbers through February, they went on to finish the year ahead of the broader equity market. Early REIT relative outperformance in 2025 was derailed by unexpected shocks related to new tariff policies. Notably, REIT relative outperformance in early 2026 was the strongest since 2006. While past results may not be indicative of future performance, historical patterns appear to be holding true for 2026.
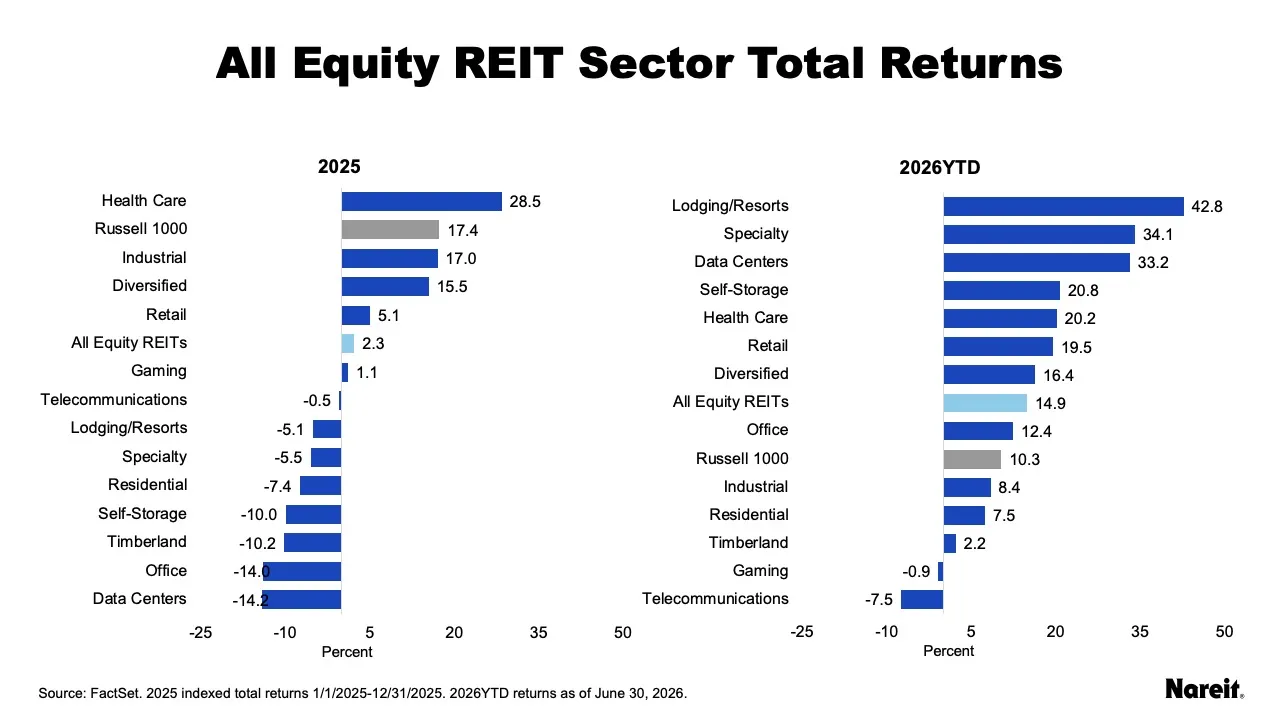
The chart above presents 2025 and mid-year 2026 total returns for the 13 equity REIT property sectors, as well as the aggregate REIT market (FTSE Nareit All Equity REITs Index) and broad equity market (Russell 1000 Index).
The Russell 1000 posted a total return of 17.4% in 2025, outperforming the FTSE Nareit All Equity REITs Index by 15.1 percentage points. In 2026, REITs saw this reverse; at mid-year, the REIT total return was 14.9%, besting the broad equity market by 4.6 percentage points. Consistent with past research, this performance shows that REITs can do well in an elevated and rising interest rate environment. In addition, solid operational gains and disciplined balance sheets will likely help REITs maintain their outperformance over broad equities this year.
At the sector level, only five of 13 REIT property sectors realized positive total returns in 2025. Driven by demographic demand tailwinds and limited new supply, health care was the top-performing sector with a total return of 28.5%. Interestingly, despite the AI-driven tech rally and persistent media coverage, the worst-performing sector last year was data centers (-14.2%).
In contrast, all REIT sectors, aside from gaming and telecommunications, had gains in 2026 as of the end of June. Propelled by strong leisure and business travel demand, lodging/resorts was the top performer with a mid-year total return of 42.8%. Trailing sectors with total returns less than 3% included timberland, gaming, and telecommunications.
The chart illustrates REITs’ relative outperformance thus far while also underscoring two themes. First, REITs have undergone a structural transformation given that more than 50% of their market capitalization is in new and emerging property sectors. This growth in sectors corresponds to a fundamental reshaping of the U.S. economy fueled by digitization, demographic changes, housing scarcity, and other secular trends. Second, institutional investors understand that unlike private real estate, REITs better reflect the modern economy. To that end, investors are increasingly using REIT-based completion strategies with private real estate to ensure their portfolios provide broader exposure to those critical sectors.
REITs Deliver Solid Operational Gains, Ready for Future Growth
Amid ongoing uncertainty, REITs have shown operational and managerial resilience. They have reliably delivered solid operational performance and have maintained disciplined, well-structured balance sheets, which will help them take advantage of future growth opportunities.
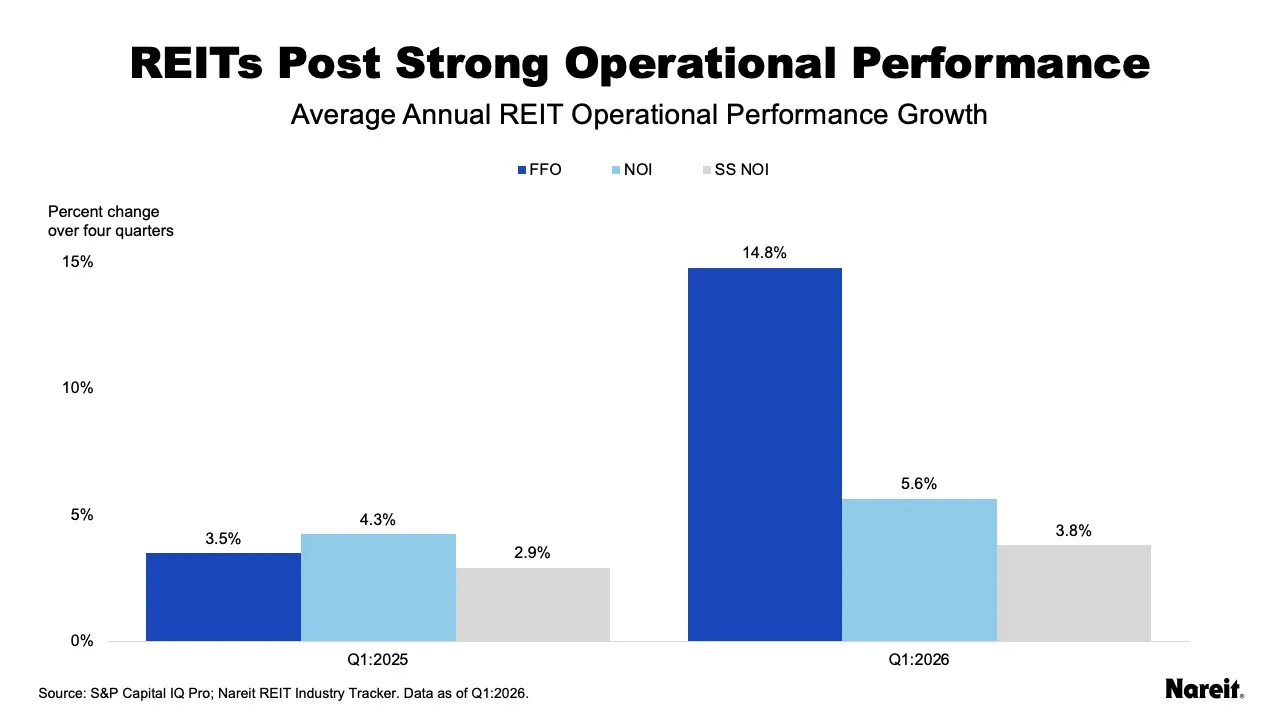
The chart above presents year-over-year funds from operations (FFO), net operating income (NOI), and same-store net operating income (SS NOI) growth rates for U.S. public equity REITs for the first quarters of 2025 and 2026.
As of the first quarter of 2026, year-over-year FFO, NOI, and SS NOI growth rates were 14.8%, 5.6%, and 3.8%, respectively. Notably, all three were greater than they were in 2025 and all have kept pace with inflation. In addition:
- nearly 65% of REITs posted positive year-over-year FFO growth rates;
- more than 75% realized positive NOI growth; and
- almost 65% had SS NOI gains.
Their continued solid operational performance during economic uncertainty reflects REITs’ thoughtful asset selection and strong management expertise.
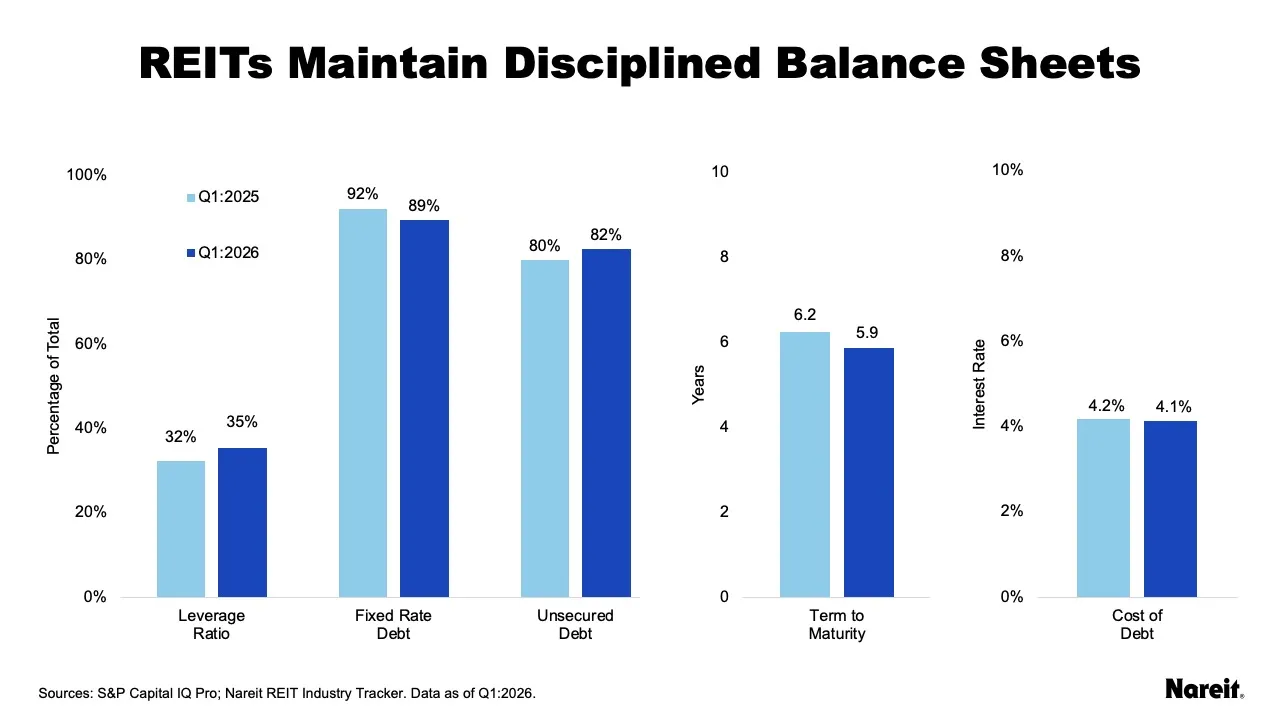
The chart above displays REIT balance sheet metrics from Nareit’s REIT Industry Tracker for the first quarters of 2025 and 2026. Both show that REITs continue to be excellent stewards of their balance sheets. REITs, on average, have maintained low levels of leverage. Combined with an emphasis on fixed-rate debt, longer debt maturities, and access to unsecured debt, balance sheet discipline has helped REITs limit their exposure to higher interest rates while providing them the financial flexibility to meet property-level and corporate capital needs.
Broad Equity and REIT Valuations Converge
While broad equity and REIT market valuation dislocations are uncommon, they have historically presented buying opportunities for REIT investors. The recent divergence between broad equity and REIT valuation multiples was largely driven by the strong performance of AI-linked tech stocks. As the tech rally moderated in early 2026, the gap between broad equity and REIT valuation multiples narrowed, with REITs enjoying relative outperformance.
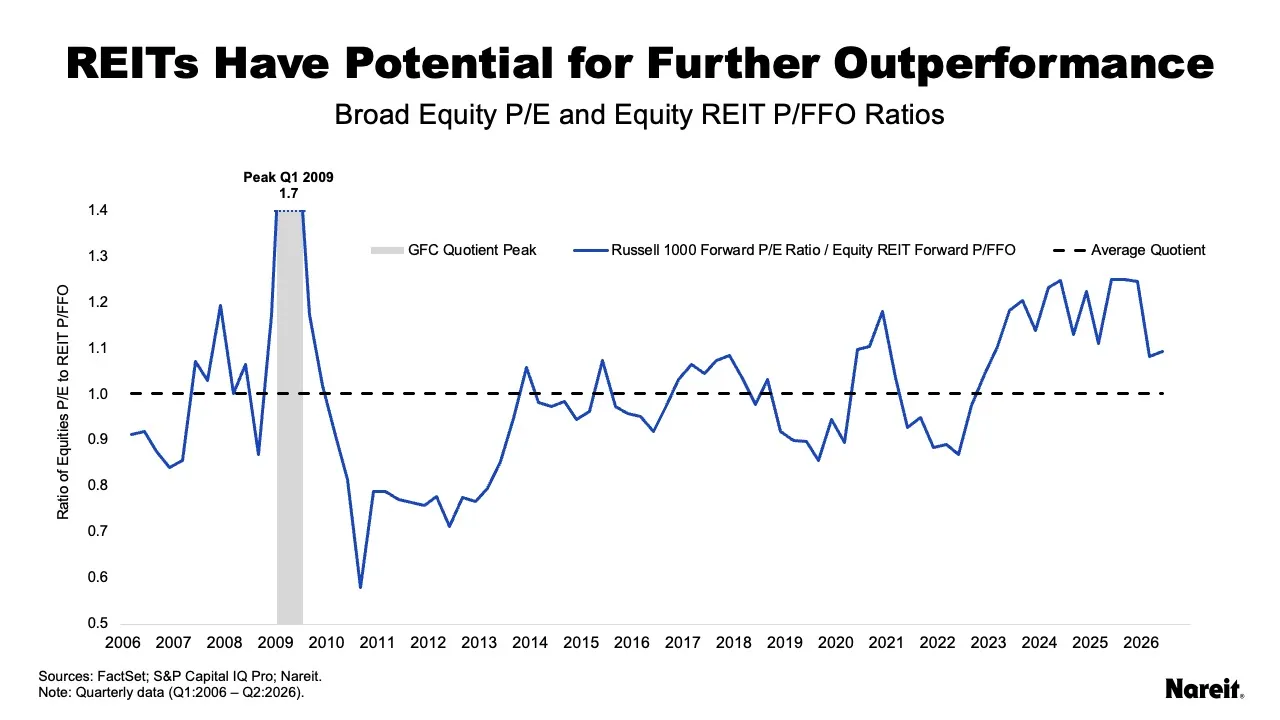
The chart above displays the Russell 1000 forward (next 12 months) price to earnings (P/E) ratio divided by the equity REIT forward price to funds from operations (P/FFO) ratio from the first quarter of 2006 to the second quarter of 2026. A ratio near 1 indicates that the two markets are trading at similar relative valuations. Since 2006, this valuation quotient has reached unusually elevated levels during three periods: the global financial crisis (GFC), the COVID-19 pandemic, and the recent AI-driven tech rally.
The current dislocation emerged in late 2022 and persisted through 2025. During this period, the Russell 1000 P/E ratio expanded by more than 40% and the equity REIT P/FFO increased just over 10%. As the tech rally moderated, the broad equity multiple edged lower, while strong REIT performance lifted the REIT multiple higher, causing the valuation quotient to decline. Further narrowing of the valuation gap will likely result in continued REIT relative outperformance in 2026.
Lingering Public-Private Real Estate Valuation Divergence
While broad equity and REIT valuation multiples have started to converge, the public-private real estate divergence continues to linger as private appraised property values seem disconnected from economic and financial market realities. For example, on average, private real estate appraisal cap rates have essentially remained at year-end 2021 REIT implied cap rate levels for the past three years. In addition, private appraisal cap rates have also maintained only modest spreads over U.S. 10-year Treasury yields.
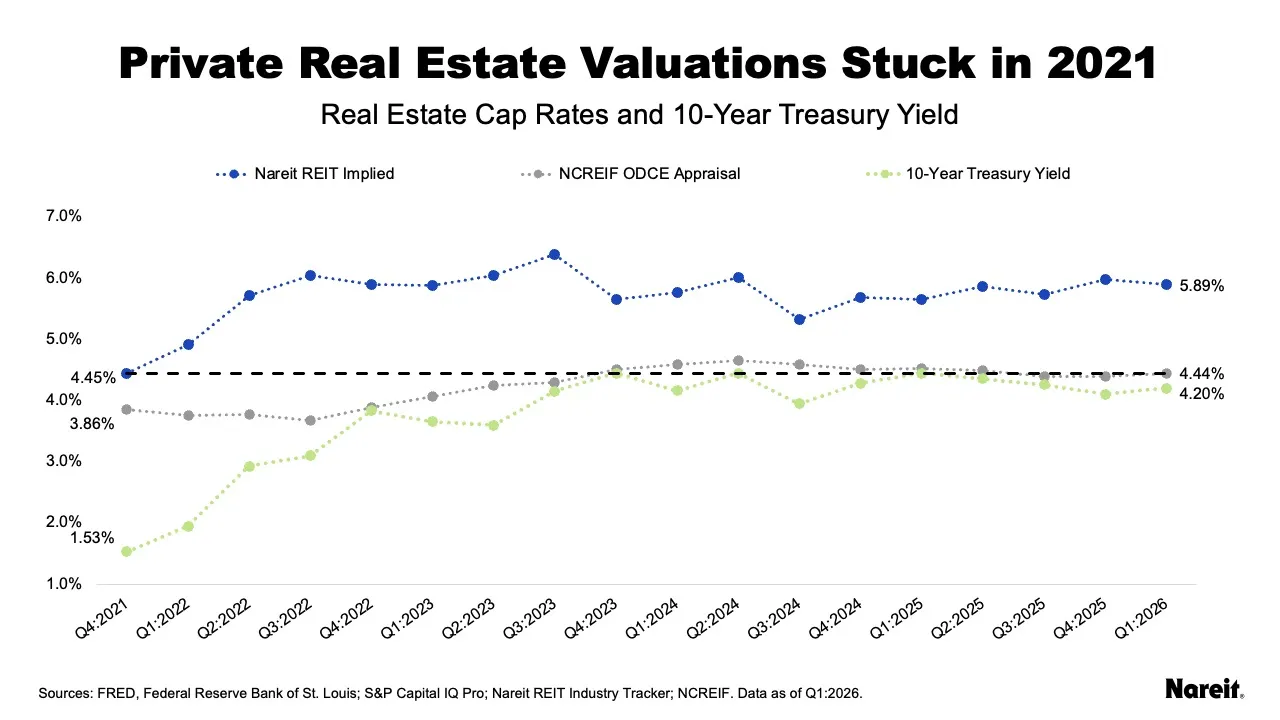
The chart above displays REIT implied cap rates from Nareit’s REIT Industry Tracker , private real estate appraisal cap rates from properties in the NCREIF ODCE funds, and average U.S. 10-year Treasury yields since the fourth quarter of 2021. The chart also includes a horizontal black dashed line at the current ODCE appraisal cap rate level of 4.44%.
The length of the current public-private real estate valuation dislocation is now at a record 17 quarters, with the cap rate spread remaining wide at 1.45%. While the REIT cap rate has reacted meaningfully to changes in the 10-year Treasury yield, the private appraisal cap rate has not; it has essentially remained stagnant at the year-end 2021 REIT implied cap rate level for the past three years.
Over this time, private appraisal cap rates have also maintained only modest spreads over U.S. 10-year Treasury yields, averaging just 27 basis points (bps). In comparison, the average REIT implied cap rate spread was 163 bps and Moody’s highest-rated corporate bond spread averaged 94 bps. These comparisons highlight untenable relationships between private appraised property values and financial markets.
Private real estate appraisers and portfolio managers may have been hopeful that the market would come to them, but these hopes have likely been dashed by higher interest rates. As private appraised valuations are ultimately marked to market, the public-private real estate valuation gap will close and REITs will likely enjoy relative outperformance.
REIT Consolidation and Growth
The REIT industry has experienced significant volumes of high-value consolidations across public and private entities year to date, indicating that financial markets are working properly. While privatizations in the REIT landscape have increasingly attracted media attention, the most significant capital shifts (over 80% of total transaction dollar volume) have been strategic consolidations between public-listed REITs.
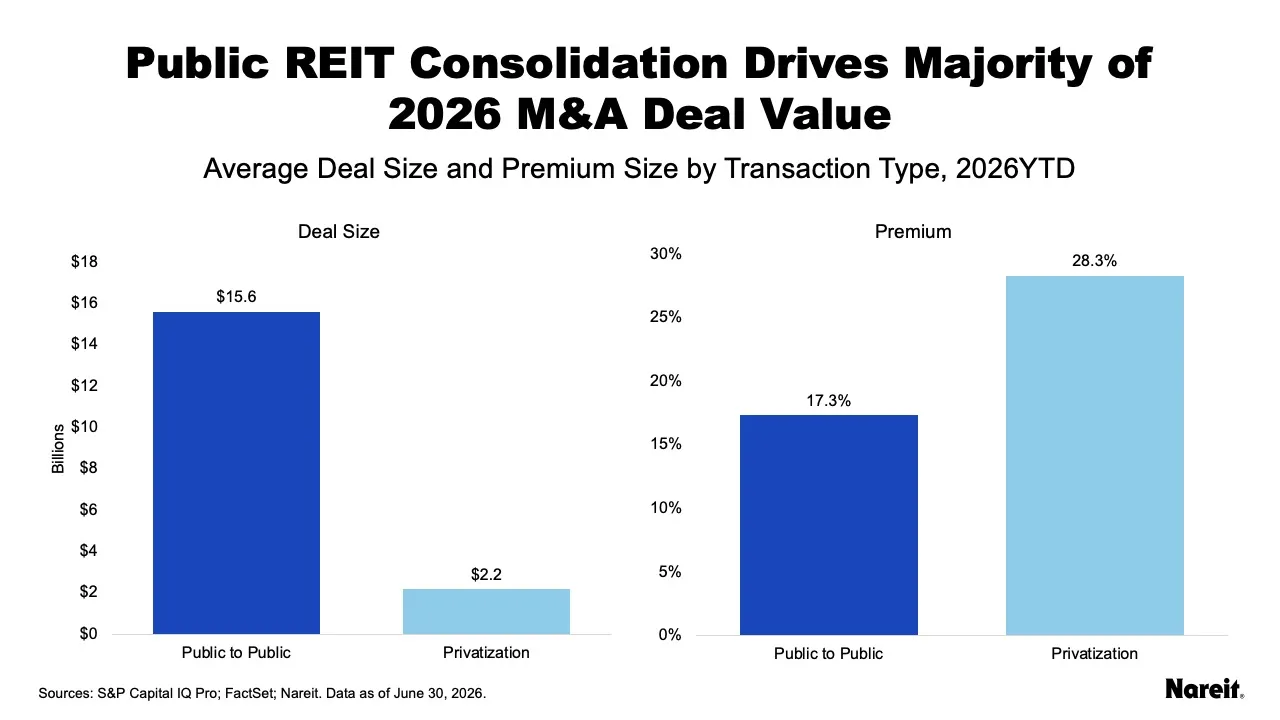
The chart above highlights 2026 REIT M&A activity through June, displaying the average deal sizes and premiums by transaction types. The REIT sector had eight transactions valued at $57.7 billion, including three mergers valued at $46.8 billion between public-listed REITs and five privatizations valued at $10.9 billion.
More than 80% of total transaction dollar volume occurred between public-listed REITs seeking scale, operational efficiencies, and complementary portfolio benefits. Privatizations accounted for a minority, but focused, portion of transaction dollar volume. On average, privatization deals tended to be smaller (by approximately 85%) and carried higher premiums (by 11%) than their public-listed REIT counterparts. Consolidation and growth trends have resulted in larger public-listed REITs with a current average market capitalization of over $11 billion.
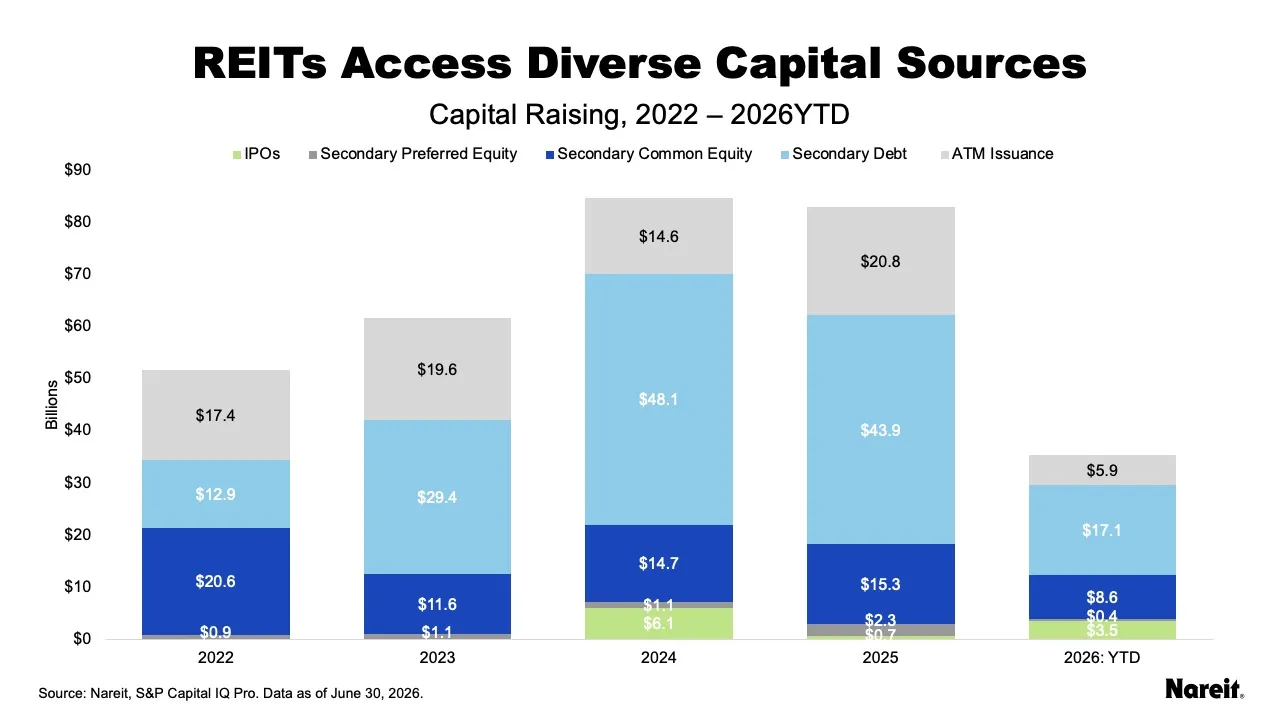
With their sizable presence in M&A activity, REITs have maintained ready and efficient access to the equity and debt markets. The chart above summarizes REIT capital raising activity from 2022 to 2026.
Access to unsecured debt offers REITs a competitive advantage over many of their private real estate counterparts. Since 2022, secondary debt has taken on an increasingly larger share of REIT capital raising activities, accounting for roughly 48% of total year-to-date 2026 REIT fundraising and averaging more than 46% across the examined five years. Coupon rates for REIT unsecured debt have remained attractive and stable, averaging approximately 5.3% in 2025 and 2026.
Through June 2026, REITs raised $35.4 billion of capital including $17.1 billion in secondary unsecured debt, $8.6 billion in secondary common shares, $5.9 billion in at-the-market (ATM) equity offerings, $3.5 billion in initial public offerings (IPOs), and $0.4 billion in secondary preferred shares. REIT IPO activity saw healthy investor interest. Two IPOs were in health care (the best-performing sector in 2025) and one was in data centers (one of the top-performing sectors through mid-year 2026).
Importantly, REITs have been further diversifying their sources of available capital by establishing joint ventures with institutional investors and investment management platforms. Today, many REITs have access to broader menus of capital sources than most other institutional real estate investors.
Bright Prospects Ahead
Looking ahead, many factors support a positive outlook and constructive role for REITs in investor portfolios in the second half of 2026 and beyond:
- Some elements of macroeconomic uncertainty appear to be resolving. Although interest rates may be elevated, past research shows that REITs can do well in this environment.
- Continued solid operational performance and disciplined balance sheets highlight asset selection and managerial expertise, which should propel future REIT performance.
- The growth of new and emerging property sectors—and REITs’ expertise in them—offer institutional investors easy and efficient ways to modernize their existing portfolios.
- Convergence between broad equity and REIT valuation multiples and public and private real estate valuations will likely result in REIT relative outperformance.
- Open capital markets and diversified capital sources will continue to fuel strategic M&A activity, enabling REITs to continue growing in scale and building their operational platforms.
Taken together, these factors underscore why REITs are entering the second half of 2026 with strong momentum. Supported by solid fundamentals, improving valuation dynamics, and durable access to capital, the industry is well positioned for continued relative outperformance and long-term growth.