The global active manager tracker follows the quarterly investment holdings by the 25 largest actively managed funds invested globally. As of the end of the second quarter of 2026, the funds were invested in 35 countries and regions with nearly $18 billion in assets under management (AUM).
- In the second quarter, active managers maintained their overweight exposure in the Americas (AMER). In comparison, the Europe, Middle East, and Africa region (EMEA) was underweight relative to the FTSE/EPRA Nareit Developed Extended Index.
- AMER health care remained the regional sector with the largest allocation at 15.5% followed by APAC diversified at 13.8%.
- AMER health care also had the largest annual and quarter-over-quarter gain of all the regional sectors, up 4.0 and 1.0 percentage points, respectively.
- Within APAC, office posted the highest annual gain (up 0.3 percentage points), while quarterly movements for all sectors were modest.
- AMER data centers continue to be the most overweight sector by 2.6 percentage points.
- Office is the most overweight by share of its index weight in AMER, while residential is the most overweight in APAC, and self-storage is the most overweight in EMEA.
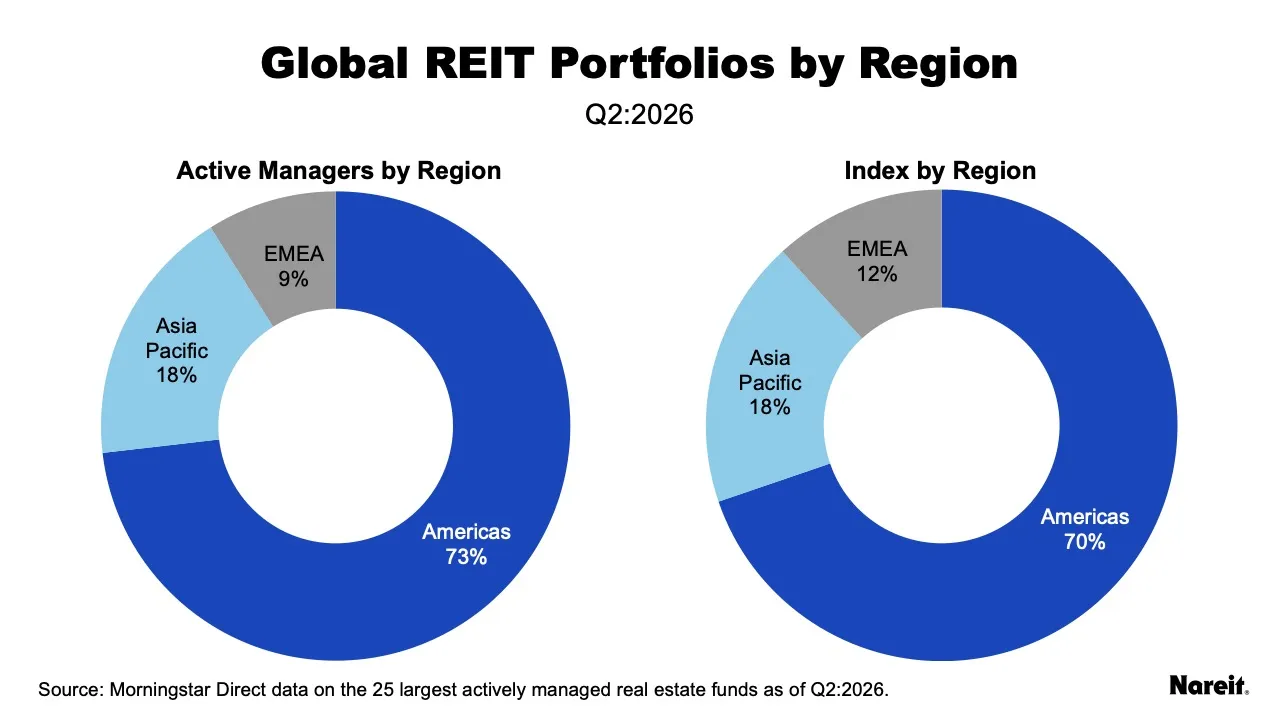
Compared to the FTSE Nareit Developed Extended Index, the actively managed funds are overweight in AMER (primarily the U.S.) and underweight in EMEA ,as shown in the chart above.
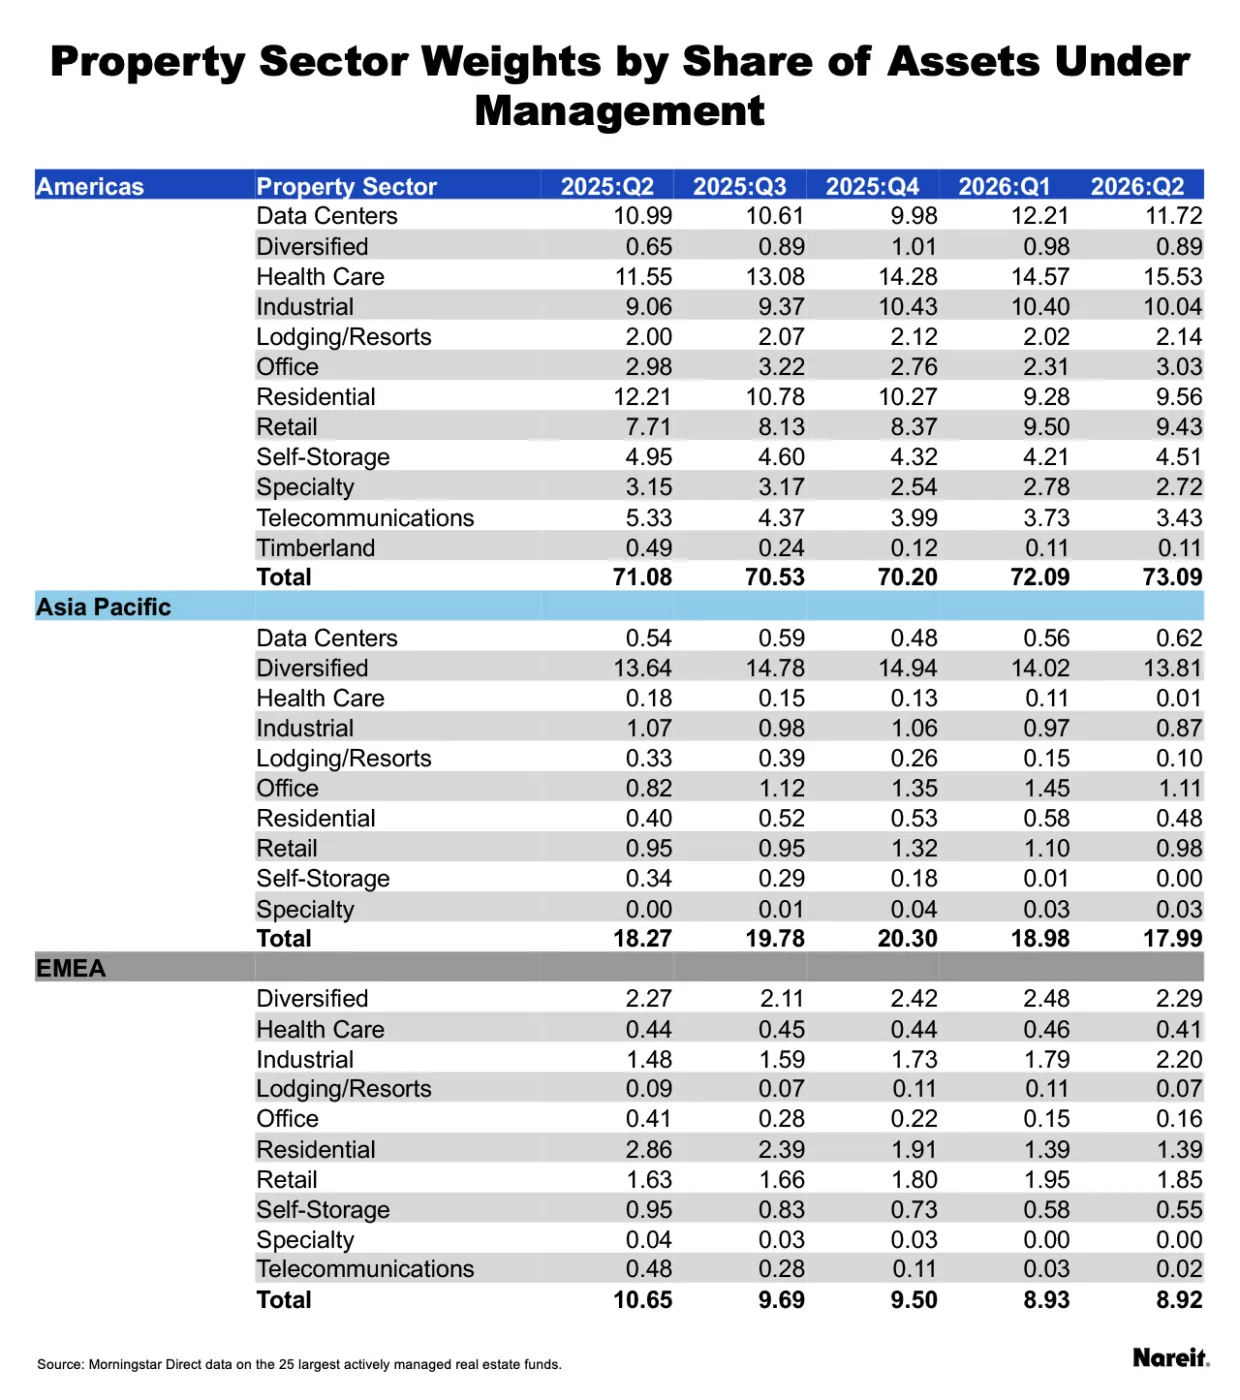
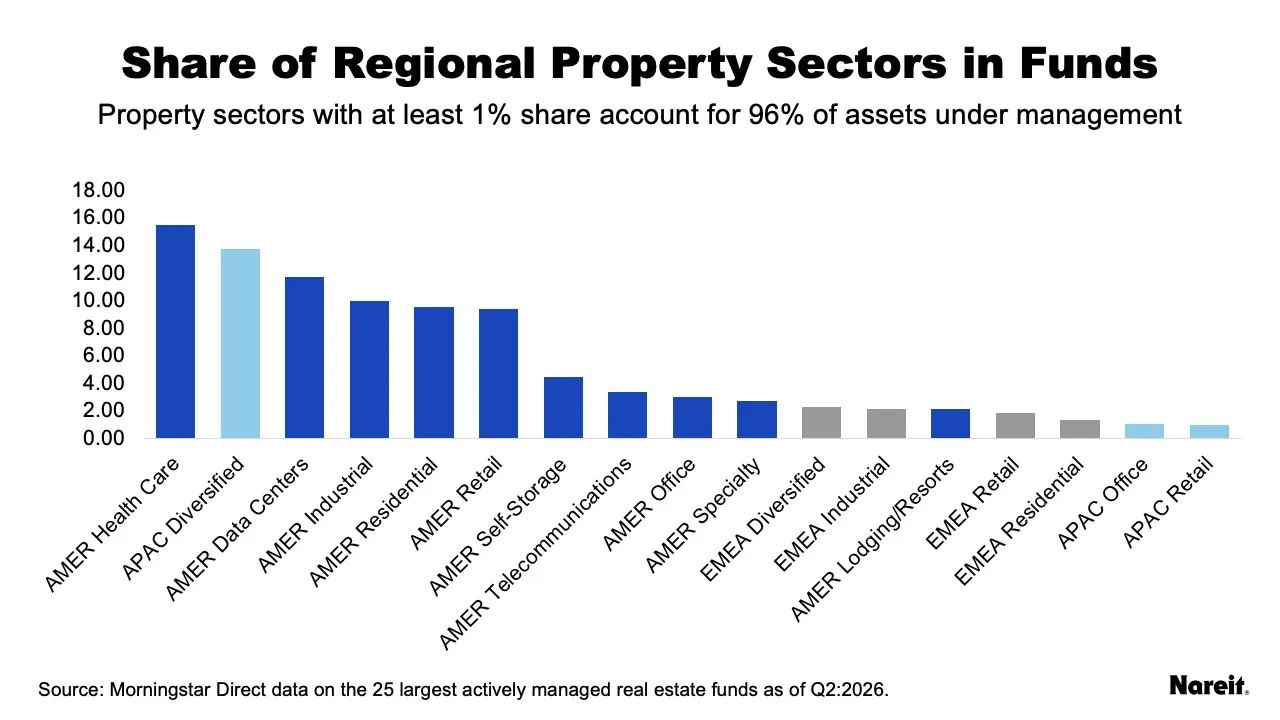
The sector weights by region over the past five quarters are shown in the table above, with the most recent quarter weights shown in the chart. With the funds overweight in AMER, most of the sectors in the region outweigh other regional sectors. [Note that this data is from June 30, and thus before the announcement of Prologis, Inc.’s planned acquisition of SEGRO.
- AMER health care has the largest allocation in the funds at 15.5%. The regional sector’s weight has been increasing over the past year.
- APAC diversified has the second highest allocation at 13.8% for the second quarter in a row. Diversified accounts for 76.1% of total APAC AUM.
- AMER data centers rounded out the top three at 11.7% due to its steady increase in the past three quarters.
- For EMEA, the sector with the largest allocation is diversified at 2.3%, with industrial (2.2%) and retail (1.8%) finishing out the top three.
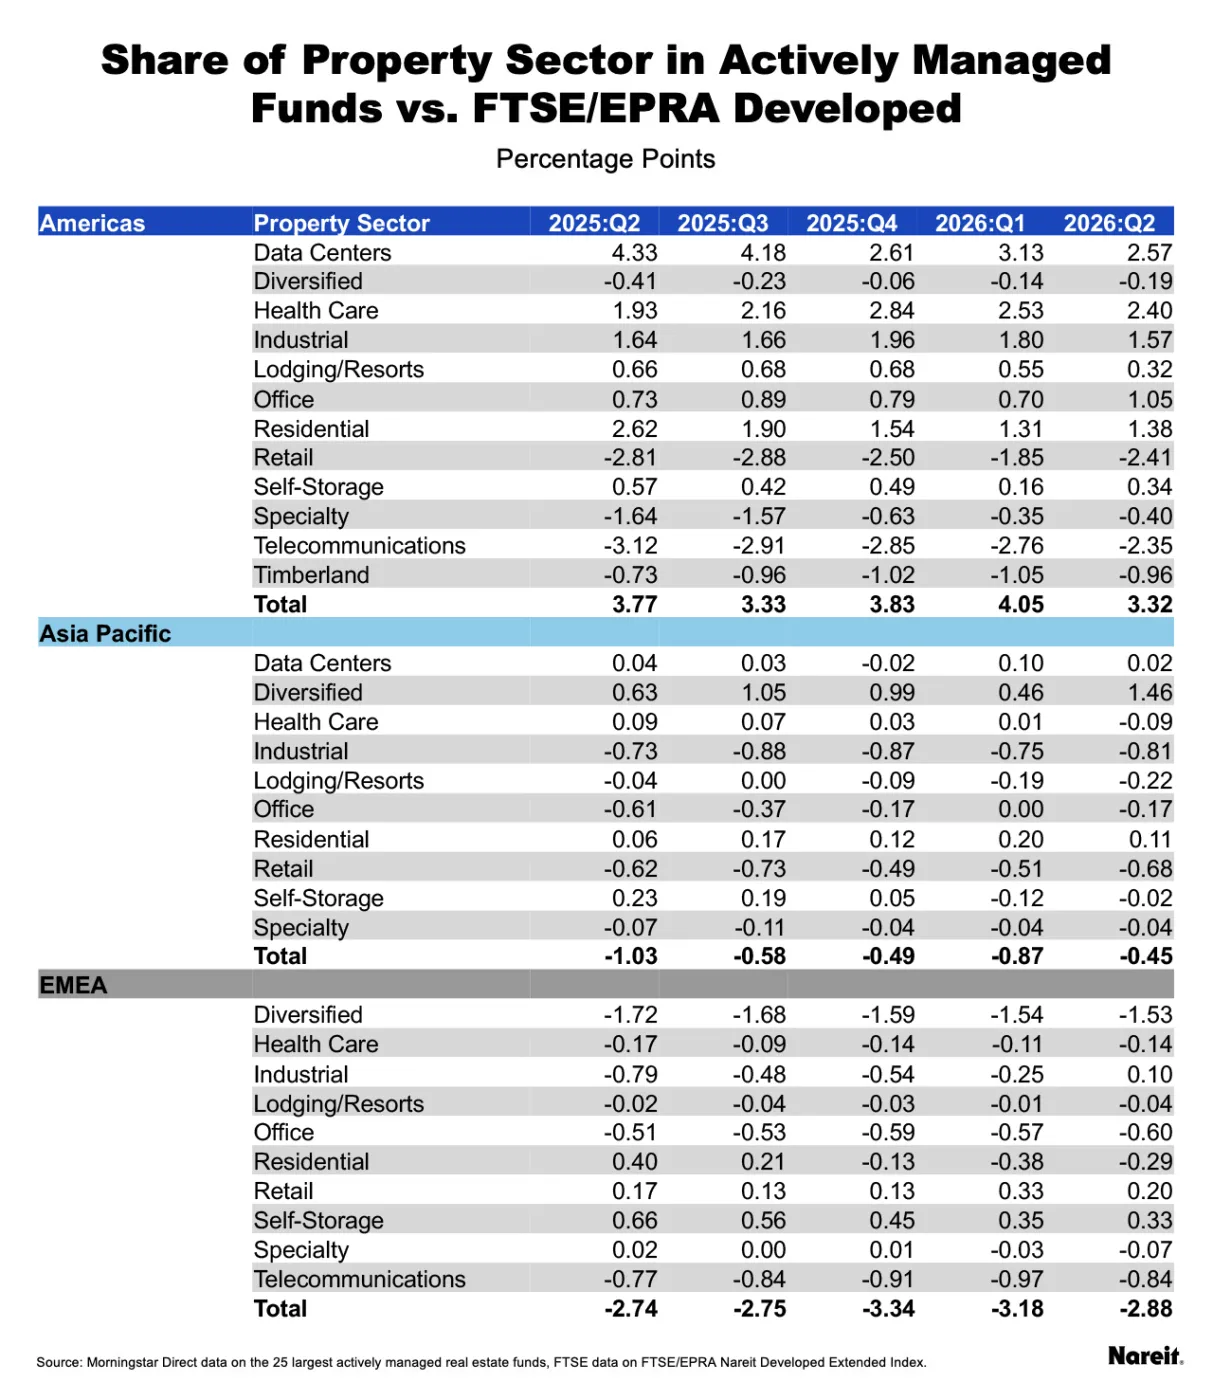
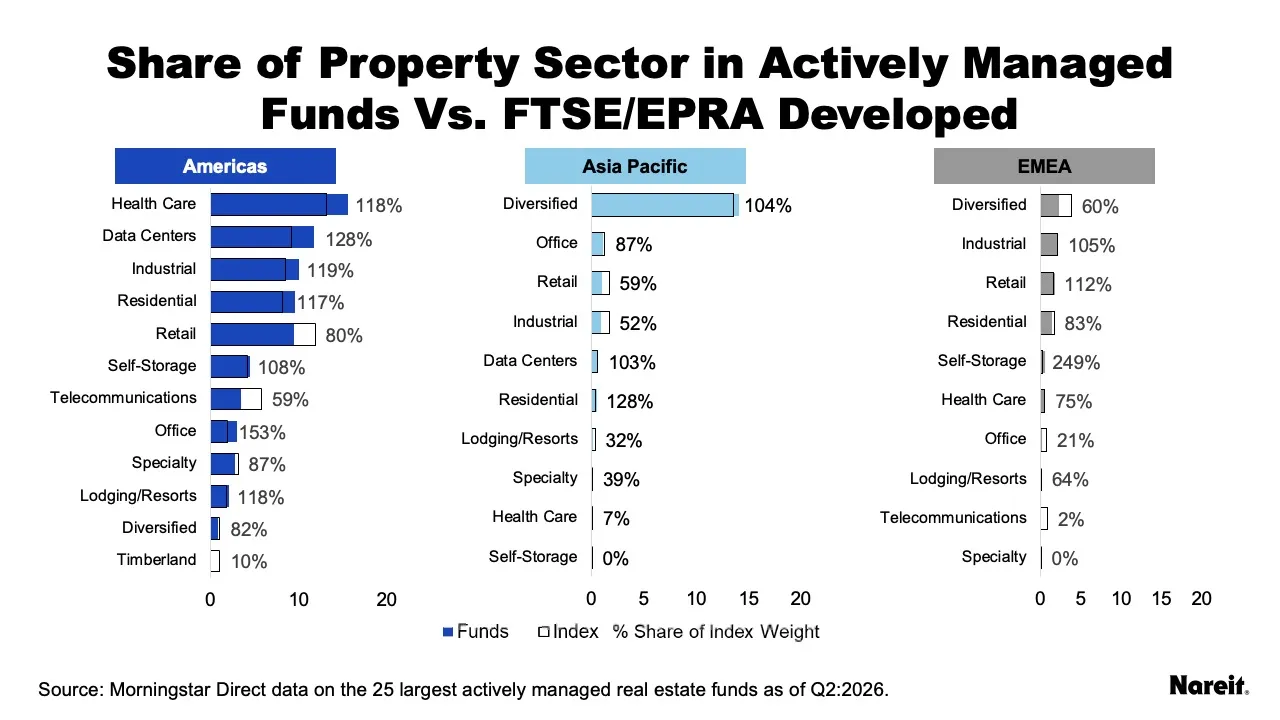
The chart and table above compare the weight of the sectors in actively managed funds to the weight of the sectors in the FTSE/EPRA Nareit Developed Extended index. The colored bars in the charts represent the weight of the regional sectors in the funds, the outlined bars represent their weights in the index, and the percentage represents the ratio of the fund weight relative to the index weight.
- AMER data centers remains as the most overweight sector in absolute terms at 2.6 percentage points. Seven out of 12 AMER sectors are overweight in the funds.
- Three out of 10 APAC sectors are overweight this quarter, down from four the previous quarter. Diversified was the most overweight sector by 1.5 percentage points.
- Three sectors in EMEA are overweight this quarter, led by self-storage (up 0.3 percentage points), followed by retail (up 0.2 percentage points) and industrial (up 0.1 percentage points). EMEA self-storage is the most overweight of all the regional sectors relative to index share at 249% on a very small base.
- Other notably overweight regional sectors relative to their index are AMER office (153%) data centers (128%), and APAC residential (128%).
- AMER retail is the most underweight sector in absolute terms by 2.4 percentage points followed by AMER telecommunications (2.3 percentage points), and EMEA diversified (1.5 percentage points).
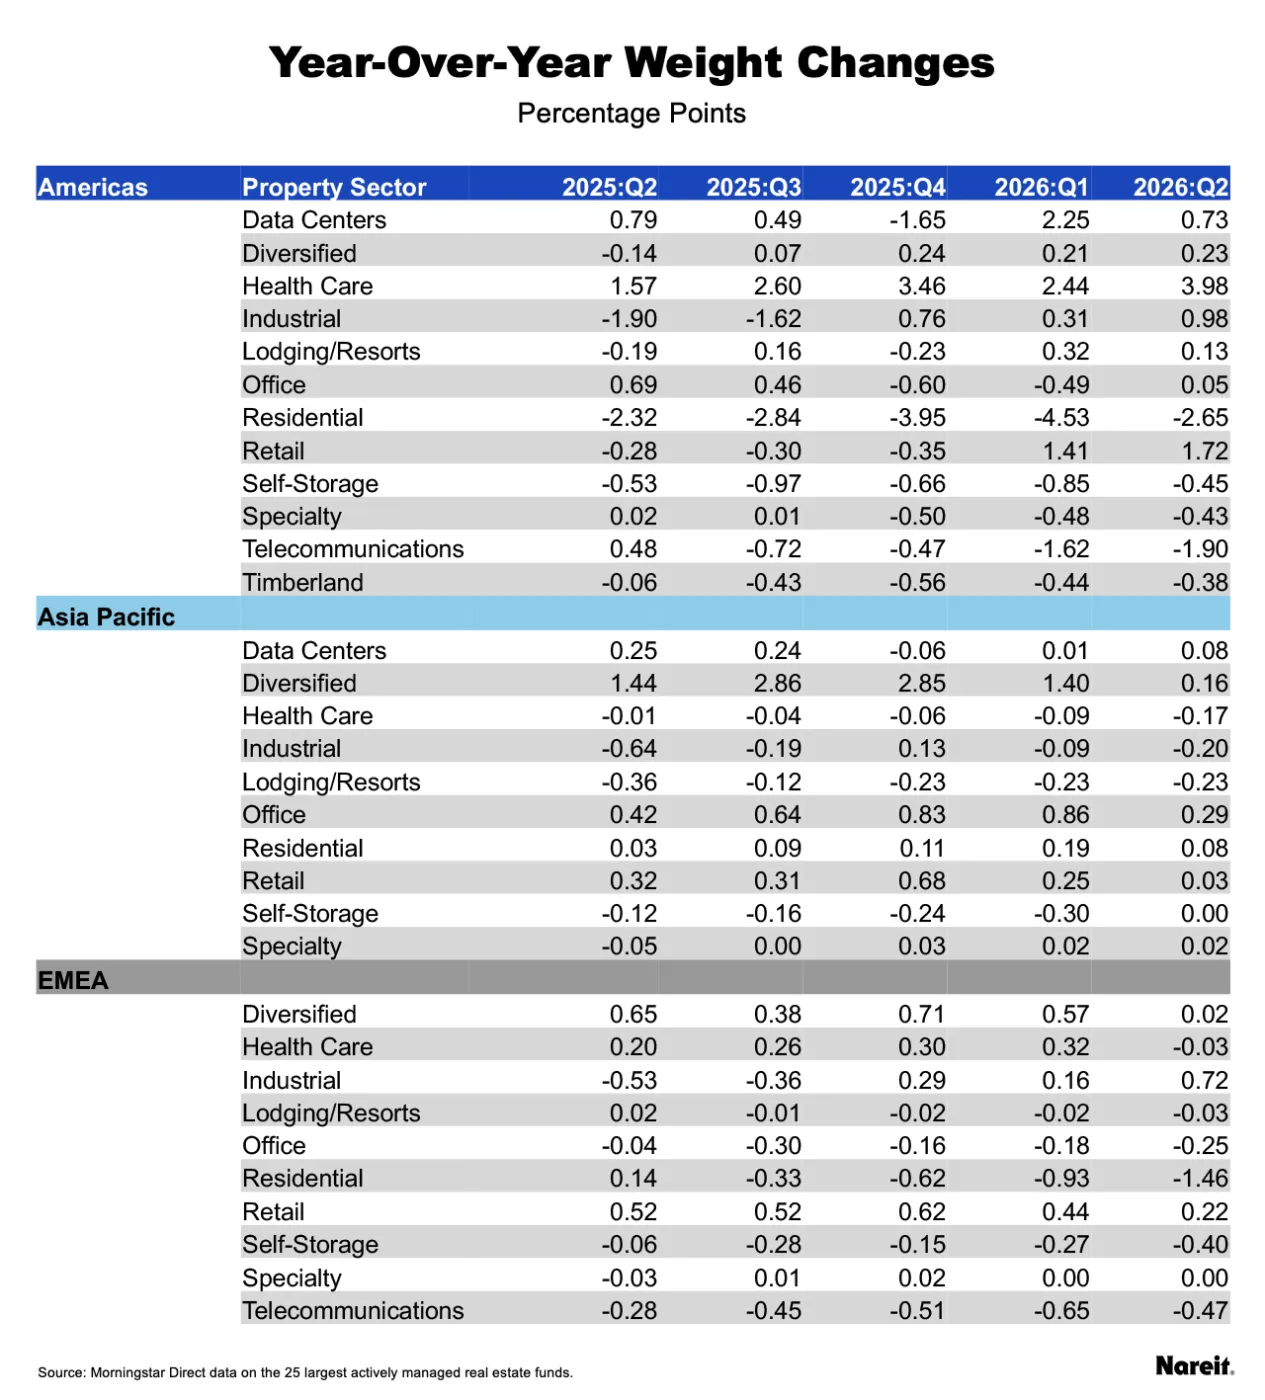
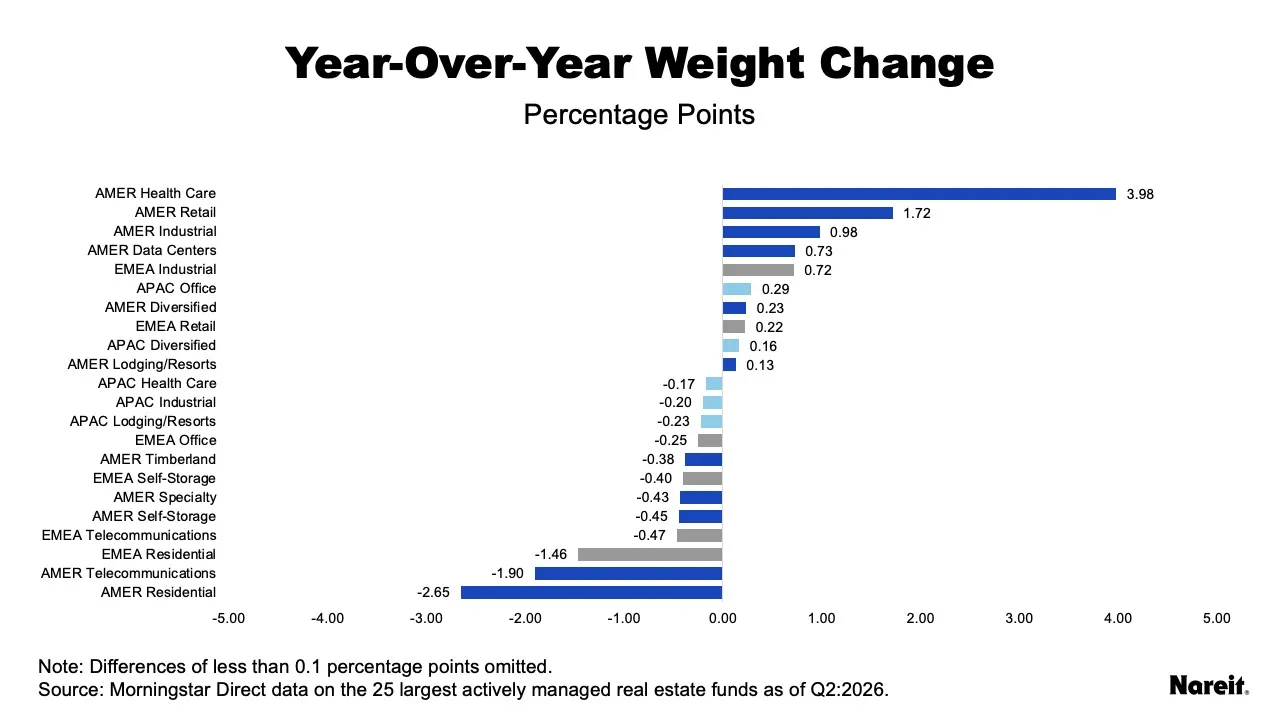
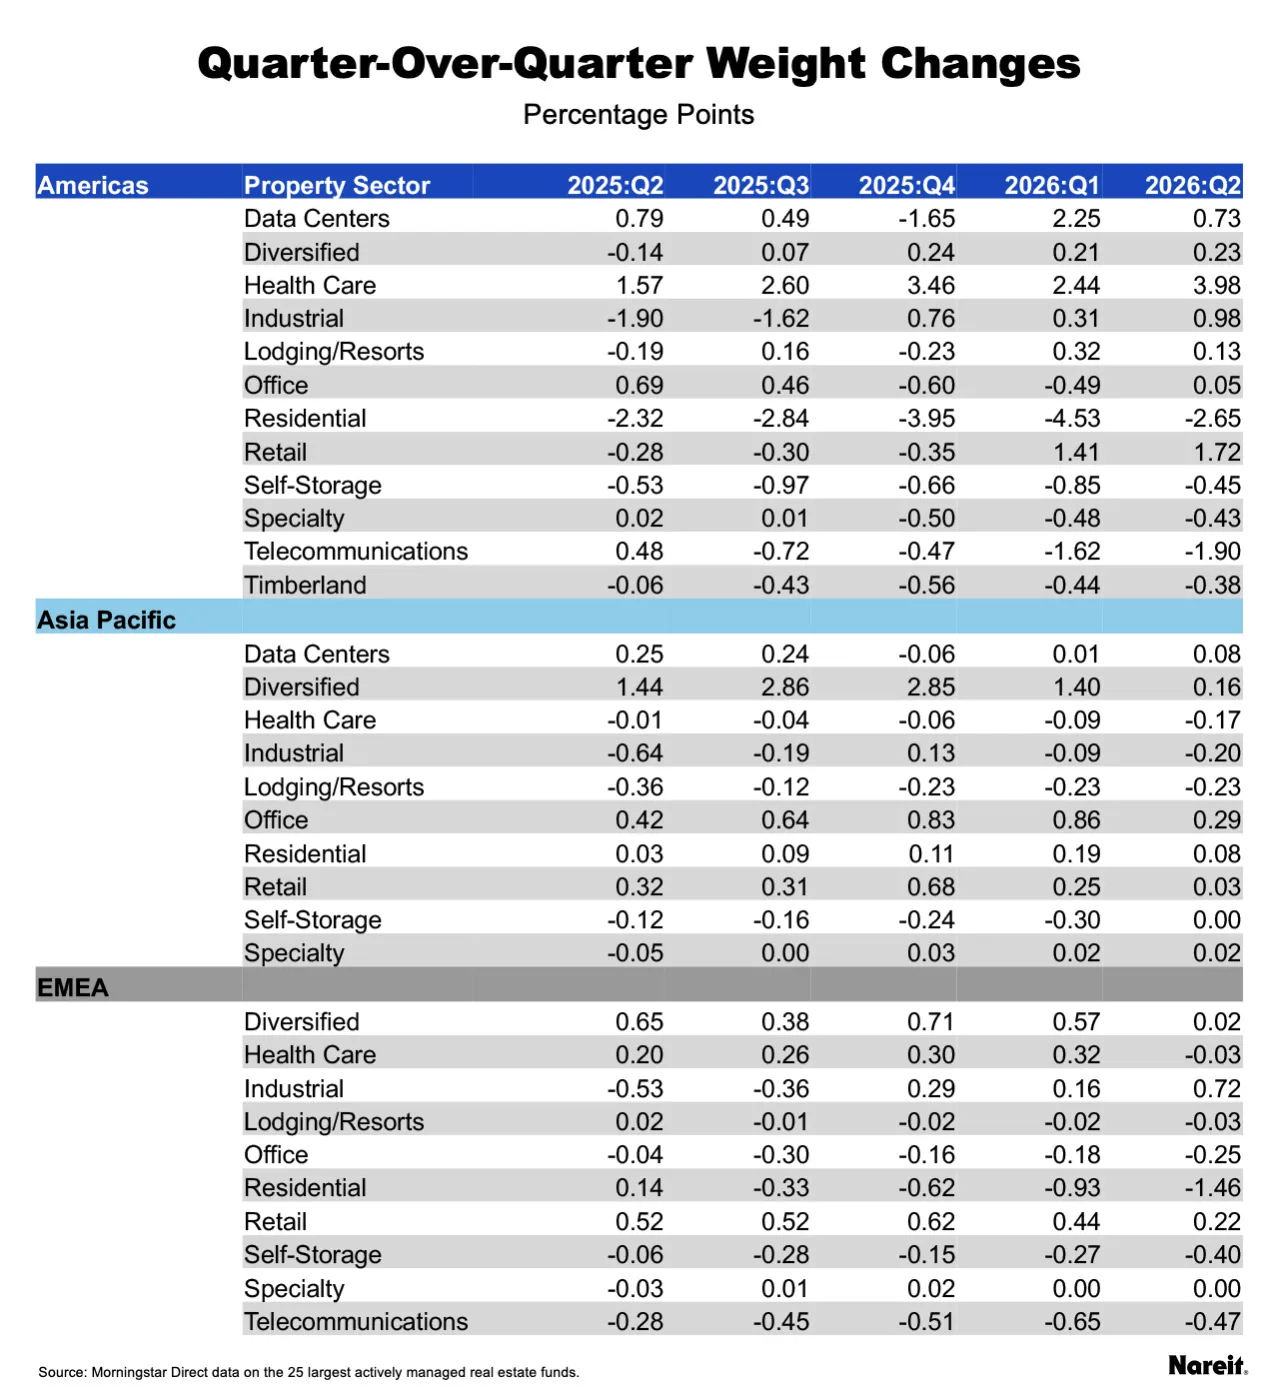
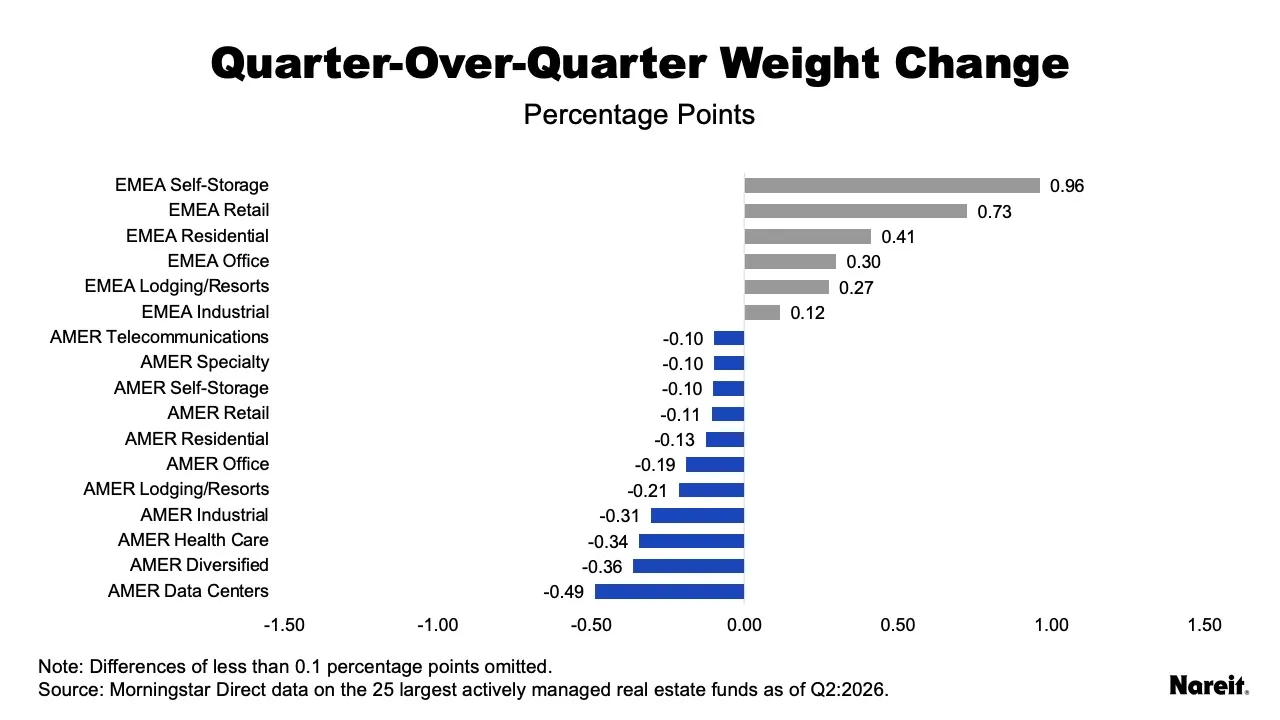
Changes from the previous quarter and previous year are shown in the tables and charts above.
Overall, the annual change in the weight of the property sectors in the AMER region were mixed, with big gains only in AMER health care and retail. Conversely, many sectors in the EMEA and APAC region exhibited modest annual declines, though EMEA industrial increased by 0.7 percentage points.
- AMER health care had the largest annual and quarterly increase, up 4.0 and 1.0 percentage points, respectively.
- AMER retail had the second largest annual gain at 1.7 percentage points but saw a modest quarterly decline of 0.1 percentage points.
- AMER residential had the largest declines year-over-year at 2.7 percentage points, continuing its consecutive decline for five quarters in a row.
Similarly to the annual weight changes, the AMER region saw mixed results while many sectors in the EMEA and APAC region experienced modest declines.
- For EMEA, industrial had the largest quarterly and annual gains of 0.7 and 0.7 percentage points, respectively.
- AMER office had the second highest quarterly gain at just 0.7 percentage points after a few quarters of declines. The sector exhibited similar trends annually.
- The largest decline for the quarter was in AMER data centers, down 0.5 percentage points, though the sector was up year-over-year.
Note that four of the 25 funds had not reported third quarter data for this analysis.
For more information on the global active manager project, see New Actively Managed Global Real Estate Funds Tracker Shows Diversity in Geographic, Sector Holdings