Differences in performance among segments of the equity markets have been more noticeable this year than usual. Through the first eight months of 2017, for example, companies in the Information Technology sector had returned +26.6% while those in the Energy sector had returned -15.1%; the Health Care sector was at +19.1% while the Telecom Services sector was at -7.9%; large-cap growth stocks were at +20.1% while small-cap value stocks were at -1.3%. Stock exchange-listed equity REITs had returned 6.9% through August, comfortably better than some segments of the stock market although not in the nosebleed territory occupied by the tech stocks.
I’ve pointed out before that the small-cap value segment has historically been more similar to listed equity REITs than have other segments of the stock market, but that’s not saying much: the long-term average correlation in monthly total returns between the FTSE NAREIT All Equity REIT Index and the Russell 2000 Value index has been just 72% over the nearly quarter-century since the beginning of the “modern REIT era.” For comparison, small-cap value stocks have had more in common with large-cap value stocks (84%) than they had with REITs; they’ve had more in common with small-cap growth stocks (84%) than they had with REITs.
Clearly there’s no substitute for the asset class diversification that comes from investing in real estate assets, even if the portfolios that give you exposure to the real estate market cycle are owned by companies—listed equity REITs—that are otherwise fundamental value-oriented companies that are nowhere near as large as some of the behemoths in the stock market.
September provided another illustration of the differences between listed equity REITs and non-REIT companies that are also value-oriented and of smaller size, though REIT investors weren’t the beneficiaries in this particular case: the Russell 2000 Value Index showed total returns of +7.08% compared to -0.79% for the FTSE NAREIT All Equity REIT Index. On a year-to-date basis it’s still true that listed equity REITs have outperformed the non-REIT companies that are otherwise most similar to them, with year-to-date total returns of 6.04% for the FTSE NAREIT compared to just 5.69% for the R2000V, but the short-term historical return gap between them narrowed considerably.
Given how noticeable (okay, let’s just say “weird”) the gyrations of the non-REIT stock market have been this year, I figured it’s a good time to review the differences between listed U.S. REITs and the various other segments of the U.S. stock market.
To begin, Chart 1 compares the average annual total returns (compounded) by sector over the 25 years since the modern REIT era began in late 1992. Listed equity REITs, with total returns averaging 11.0% per year have not been the only high-return investment over the past quarter-century, but better investments have certainly been scarce. Of particular interest is the Financials sector (shaded), which included REITs until September of last year: even with its better-performing equity REIT members helping for all but one of the last 25 years, the Financials sector returned just 8.9% per year. Even allowing for this year’s relative performance, it makes you realize just how much better investors have fared with listed equity REITs than with Financials.
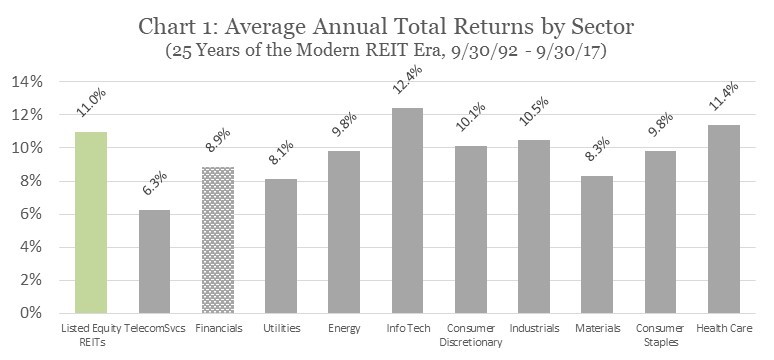
Chart 2 compares total returns for listed equity REITs with the four corners of the “style box.” I’ve included the past 30 years and the past 20 years as well as the past quarter-century, although it’s useful to keep in mind that the past 30 years extends into the “pre-modern REIT era” while using 20 years gives more relative weight to the Great Financial Crisis. Despite the severity of the GFC, over 20 years there is no style that has rewarded investors as listed equity REITs have with total returns averaging 9.3%/yr: not small-cap value stocks (8.8%/yr), not large-cap value stocks (7.5%/yr), not small-cap growth stocks (6.4%/yr), not large-cap growth stocks (6.8%/yr). Over the longer historical periods, however, the small-cap value segment edged out listed equity REITs with total returns of 11.1%/yr vs 11.0%/yr over 25 years and 11.6%/yr vs 10.9%/yr over 30 years.
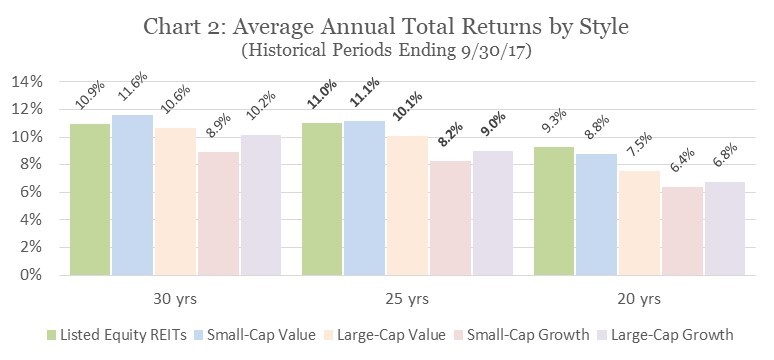
Chart 3 compares annualized volatilities based on monthly total returns by sector over the same historical period. It’s important to keep in mind that listed equity REITs are a subset of a sector (or were, until the “Real Estate” sector was created last year), and a more narrowly defined category will generally have greater volatility than a broader, more diversified category—so it’s striking that listed equity REITs have nonetheless shown less volatility (18.9%) than several of the broad sectors including Telecom Services at 19.1% and of course the very risky Information Technology sector at 25.0%. Particularly striking is the fact that the Financials sector was noticeably more volatile than listed equity REITs at 21.1% despite the fact that it benefited from the presence of listed equity REITs for the first 24 years: clearly non-REIT financial companies have subjected investors to a double-whammy of relatively poor total returns plus relatively high volatility—and they no longer have equity REITs nearby to disguise that fact.
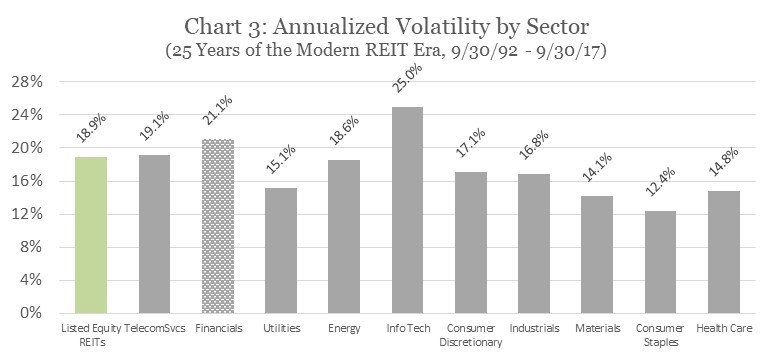
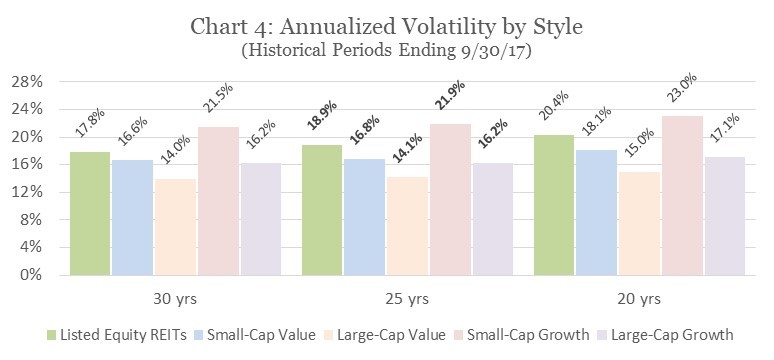
Chart 4 compares annualized volatility by style. Again, any smaller category such as listed equity REITs can generally be expected to show more volatility than any large, broad-based category such as small-cap value stocks. Also, large-cap companies are generally less volatile than small-cap companies—and even the largest listed equity REITs are small compared with the behemoths that dominate the Russell 1000 Value Index and the Russell 1000 Growth Index. Finally, equity REITs saw an out-of-proportion spike in volatility during the liquidity crisis that still hasn’t been explained but that may have been driven by hedge fund speculation. All things considered, it’s quite impressive that the volatility of the comparatively small listed equity REIT industry, averaged over the modern REIT era, has held its own with the volatility of market segments many times its size.
Where the rubber hits the road, of course, is risk-adjusted returns. For investments that are frequently traded in liquid, well-informed markets, the Sharpe ratio (simple annual average total returns minus the simple average risk-free rate of return, divided by annualized volatility) is a good measure of risk-adjusted returns. (Don’t use the Sharpe ratio to measure risk-adjusted returns for illiquid investments such as private real estate or private equity, however: the additional risks associated with infrequent trading in illiquid markets have been estimated to be the equivalent of lopping three to six percentage points off the average annual returns!)
Chart 5 compares Sharpe ratios by sector over the 25 years since the start of the modern REIT era. As with long-term average total returns, listed equity REITs have not been the only investment with strong risk-adjusted returns over the past quarter-century, but better investments have certainly been scarce. For example, the high-flying but risky Information Technology sector comes back down to earth (0.50) when its performance is measured on a risk-adjusted basis; so does the Utilities sector (0.44), which has boasted relatively low volatility—for stocks—but just hasn’t really brought home the bacon. In fact, only four sectors have beaten equity REITs on a risk-adjusted basis—and Industrials have beaten them by only a nanowire.
Particularly striking again has been the Financials sector, whose risk-adjusted performance was downright poor (0.40) even while listed equity REITs were helping it out by boosting its returns and moderating its volatility. Without equity REITs pulling quite a bit more than their weight on a risk-adjusted basis, Financial stocks would have looked quite a bit more like the woebegone Telecom Services companies.
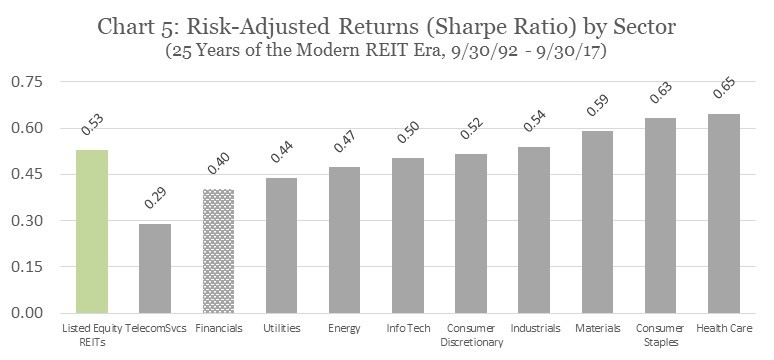
Chart 6 compares Sharpe ratios by style. As I mentioned, generally a larger, more diverse market segment such as small-cap value stocks will show lower volatility than a smaller, more defined segment such as listed equity REITs, but REITs have certainly held their own on a risk-adjusted basis, outperforming large-cap growth stocks and especially small-cap growth stocks over all three historical periods shown and outperforming large-cap value stocks over the past 20 years.
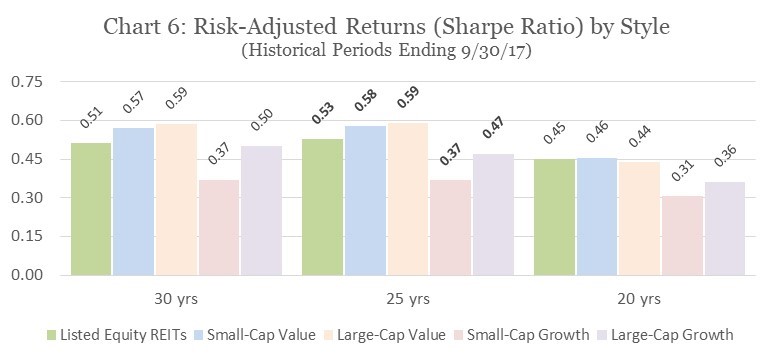
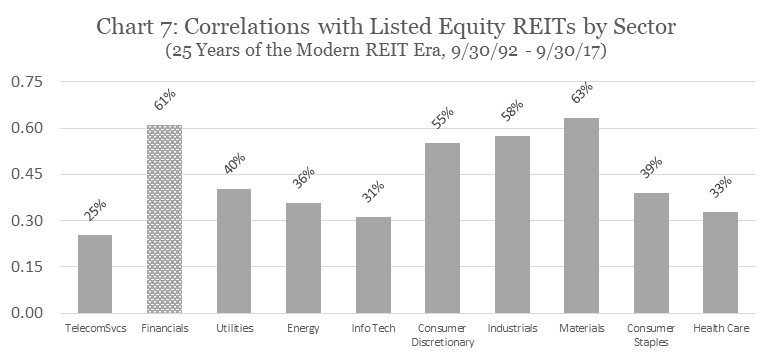
Chart 7 compares the average correlation of each sector with listed equity REITs using monthly total returns over the past 25 years. Of course it’s no surprise that the correlation of listed equity REITs with the Financials is among the highest shown, since equity REITs were trapped in that sector for the first 24 of the 25 years considered; it may come as some surprise, though, that the correlation between them was only 61%; moreover, as I’ve pointed out in other Market Commentaries, the correlation between listed equity REITs and the Financial sector is dramatically lower for investors with investment horizons longer than one month. It’s also striking that the correlation between listed equity REITs and the Utilities sector has been just 40%: for investors who think of REITs primarily for their strong, steady dividend stream (or, more generally, who think of real estate as providing nothing more impressive than bond-like returns), it must come as a surprise to realize that, yes, REITs have offered much more significant diversification opportunities than Utility stocks.
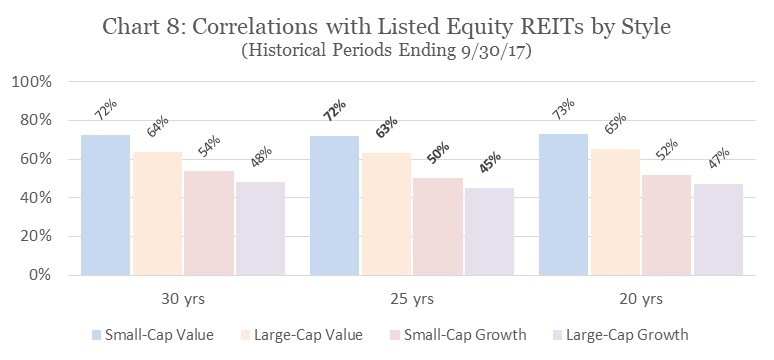
Finally, Chart 8 compares the average correlation of each style with listed equity REITs over different historical periods, again using monthly total returns. As I noted at the start, the correlation has been higher with the small-cap value segment than with the other broad styles, but even the REIT-SCV correlation has been quite low at 72% even when it is measured using monthly returns rather than the longer-horizon returns relevant to long-term investors.
In short, listed equity REITs have provided a valuable combination of investment attributes not just over a short period but over historical periods that are considerable by the standards of even the most farsighted investors:
- Total returns for listed equity REITs, as a group, have been strong compared to most other companies in the stock market. In my opinion that’s because they simply are good at what they do, which is investing in high-quality income-producing real estate and managing their real asset portfolios to achieve both steady current income and long-term capital appreciation. Even the largest, most sophisticated asset managers in the country haven’t generally been able to match the performance of listed equity REITs: every single empirical comparison that has ever been conducted—every one—has found that listed equity REITs have generated larger total returns than institutional real estate investments in similar properties and using similar leverage.
- Volatility for listed equity REITs, as a group, has been surprisingly comparable to volatility for larger segments of the equity market. In my opinion that’s because their asset holdings—properties—are more transparent and easier to value than the assets of most other companies in the stock market, which means that investors have less uncertainty regarding the justified stock prices for equity REITs than for non-REIT companies of similar size.
- Risk-adjusted returns for listed equity REITs, as a group, have been competitive with other segments of the stock market and better than most other sectors—which is not surprising given their relatively strong long-term average total returns combined with their reasonable volatility.
- Finally, listed equity REITs have shown quite low correlations with every other part of the stock market, even the Financials sector of which they used to be a part. That shouldn’t be a surprise, because equity REITs offer a source of asset class diversification—exposure to the real estate market cycle rather than the business cycle—that almost no other segment of the stock market can match.
Of course, investment decision-making should always be informed by current market conditions as well as historical norms, so it’s worth pointing out that several other Market Commentaries offer information on where we are in the current real estate market cycle, interest rate sensitivities, valuations, and numerous other topics. But I hope this review of long-term investment attributes will be helpful in setting the context for your closer examination of current market conditions.
By the way, if you have any comments or questions please drop me a note at bcase@nareit.com.