Recently I’ve been publishing a series of commentaries summarizing “where we stand” in the market for listed equity real estate investment returns. The first three focused respectively on returns, correlations, and diversification benefits, followed by two others focused on valuing listed REITs using spreads between the dividend yield on exchange-traded Equity REITs and the yield on (first) 10-year U.S. Treasury securities and (second) below-investment-grade corporate bonds. As I mentioned in the previous commentaries, while the purpose of valuation is to identify assets with especially good return prospects going forward, it’s very important to keep in mind that past performance is no guarantee of future performance—and, in particular, that a valuation “model” calibrated according to past returns cannot be assured of remaining valid even as a tool for predicting future returns.
One of the most useful valuation measures can be constructed by estimating the total value of the assets owned by any REIT, subtracting liabilities (primarily debt), and comparing the REIT’s stock price per share to its net asset value (NAV) per share. Many equity analysts use such a calculation as an input to their equity opinions. One of them, Green Street Advisors, provided the historical time series of their estimates of the average equity REIT stock price premium/discount to NAV to a team of academic researchers: William M. Gentry of Williams College (my own alma mater) and Charles M. Jones and Christopher J. Mayer, both of Columbia Business School. Gentry, Jones & Mayer published a paper reporting their finding that the industry-average difference between REIT stock prices and NAVs (at least as estimated by Green Street) has historically provided a fairly reliable prediction of future returns. Specifically, the authors found “large positive excess returns to a strategy of buying stocks that trade at a discount to NAV, and shorting stocks trading at a premium to NAV. Estimated alphas from this strategy are between 0.9% and 1.8% per month, with little risk.” The reason, they reported, is that “there appears to be too much volatility in P/NAV, giving rise to potential profits from short-term mean reversion.”
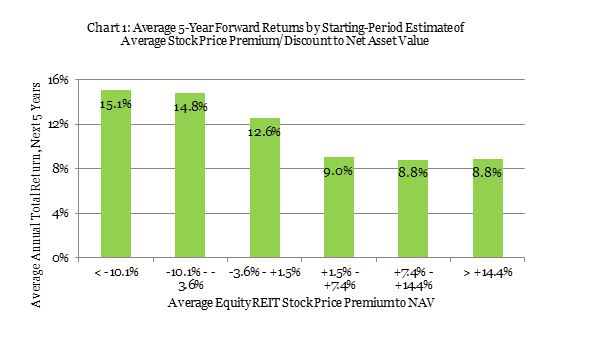
At the end of 2016 Green Street Advisors estimated that exchange-traded Equity REIT stock prices averaged about 9% less than NAV, which is in the top one-fifth of discounts seen during the modern REIT era. Over that period, as Chart 1 shows, when Green Street’s estimate of the average stock price discount to NAV ended a month in the range of between -3.6% and -10.1%, total returns over the next five years averaged 14.8% per year (with a median of 16.4%). It’s worth noting that at the end of October 2016 and November 2016 Green Street estimated that the average NAV discount was even larger, at 12% and 13% respectively; Chart 1 also shows that when the discount ended a month in the range of -10.1% or larger (that is, more negative), total returns over the next five years have averaged 15.1% per year (with a median of 15.6%).
As I discussed previously in terms of the relationship between REIT dividend yield spreads and subsequent returns, the relationship between NAV premiums/discounts and subsequent REIT returns can be modeled with a simple regression relationship. Since December 1990, five-year average total returns have tended to be about 11.88%% minus 18.97 times Green Street’s estimate of the average price-to-NAV premium at the beginning of the period. (Note: I also modeled returns over the next two, three, and four years, and I’ll discuss those results.)
The relationship “explained” forward-looking average total returns surprisingly well, with an R-squared of 11%. The reason I call that “surprising” is that the measure is specifically intended as a comparison of the valuation of exchange-traded equity REITs with the valuation of properties in the private market, rather than as a prediction of subsequent REIT returns—although Green Street does use it as one of several inputs in making their stock recommendations.
If that regression relationship continues to hold over the next five years, the price-to-NAV spread estimated at the end of 2016 suggests that total returns on exchange-traded Equity REITs would average about 13.6% per year over the next five years. As I noted in my previous commentaries, however, the problem with estimating that sort of relationship using past data and then using it to guess the future is that our measures of its explanatory power, such as R-squared, are based only on how it “explained” past data, not on how successfully it would have guessed the future. To get a handle on that question I suggested estimating the relationship using old data, using it to guess a date that is in our past but would have been in the model’s future, and then recursively updating the model and its future-guesses to see how much the model changed and how accurate its future-guesses were.
In the exercises that I did previously with Treasuries and high-yield corporates I used the first 19 years of available data (approximately the available period prior to the advent of the “modern REIT era”) to estimate the same sort of relationship and re-estimated the model each time one more month became available, dropping the oldest month to maintaining a rolling 19-year window. Unfortunately Green Street’s estimates go back only to January 1990, meaning the analysis can’t really be done for the “pre-modern era,” so let’s say instead that I used a 10-year window, with my first estimation in December 1999 using Green Street’s P-NAV estimates from January 1990 through December 1999 along with forward-looking REIT total returns through December 2004; by the end of 2016 I would have estimated the relationship 145 times.
Now let’s use all 145 models to see what they would have future-guessed based on the end-of-2016 estimated 9% stock price discount to NAV:
- The most bearish model was the most recent one, using P-NAV estimates from January 2002 to December 2011 and returns from December 2011 to December 2016, and based on the current 9% discount it would future-guess returns averaging 10.38% per year over the next five years.
- The most bullish model used spreads from January 1995 to December 2004 and returns from December 2004 to December 2009, and based on the current estimated discount it would future-guess returns averaging 20.52% per year over the next five years.
- Half of all models would future-guess returns averaging between 14.63% and 19.65% per year over the next five years. (Another ¼ of models would imply guesses averaging less than 14.63% per year, and the remaining ¼ would imply guesses averaging more than 19.65% per year.)
As with yield spreads to Treasuries and corporates, using forward-looking returns measured over other periods (the next two, three, or four years) just doesn’t make very much difference. For example, half of the two-year models (181 of them) provide future-guesses of total returns over the next two years of between 10.26% and 20.87% per year based on today’s estimate of -9%; the most recent model future-guesses 7.99% per year. The inter-quartile spreads for the three-year and four-year models are 9.57%-18.94% per year and 12.02%-18.22% per year over those respective future periods, and the most recent models future-guess returns of 7.33% per year over the next three years and 8.60% per year over the next four years.
As with any exercise of this general sort, past returns are no guarantee of future performance and the past relationship between the estimated Equity REIT stock price premium/discount to NAV is no guarantee that the relationship will continue to hold in the future. The bottom line, though, is similar to what I concluded in my previous commentaries: stock prices as of the end of 2016 were generally in the bullish part of their historic range relative to NAV—and if a wide variety of estimates of the past relationship between spreads and forward-looking returns continues to hold, that currently bullish spread would suggest relatively bullish future total returns for investors in exchange-traded Equity REITs, in the range of something like 10.3% to 20.9% per year over the next two years and 14.6% to 19.7% per year on average over the next five years.