Over the past few days I’ve published the first four in a series of commentaries summarizing “where we stand” in the market for listed equity real estate investment returns. The first three focused respectively on returns, correlations, and diversification benefits, and yesterday’s focused on valuing listed REITs using the spread between the dividend yield on exchange-traded Equity REITs and the yield on 10-year U.S. Treasury securities. As I mentioned in the previous commentary, while the purpose of valuation is to identify assets with especially good return prospects going forward, it’s very important to keep in mind that past performance is no guarantee of future performance—and, in particular, that a valuation “model” calibrated according to past returns cannot be assured of remaining valid even as a tool for predicting future returns.
The dividend yield on Equity REITs is typically less than the yield on corporate bonds rated below investment-grade. In fact, since the end of 1990 (roughly the “modern REIT era”) the month-end REIT spread to Baa corporates—that is, the average dividend yield of Equity REITs minus the average yield on Baa-rated corporate bonds according to Moody’s—has averaged -1.31% and has been positive at the end of just 21 months over that 26-year period. (Most of those months with positive yield spreads were during the liquidity crisis of 2008-09, or the REIT downturn of late 1998 to early 2000.)
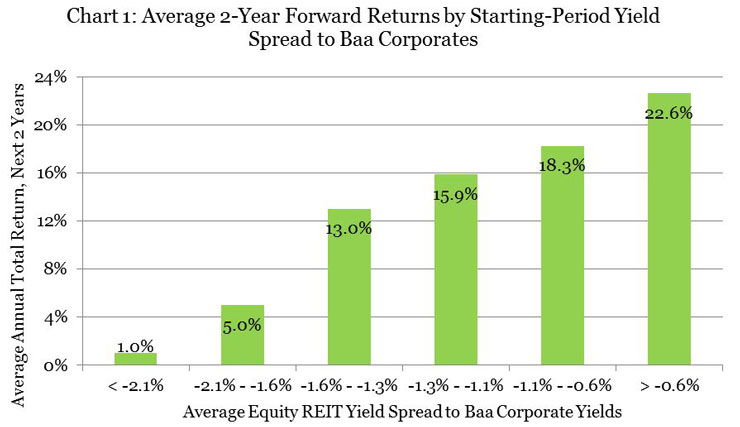
At the end of October 2016 the average Equity REIT dividend yield was at 3.91%, a spread of -0.47% relative to the Baa corporate bond yield of 4.38%. That was uncommonly high—in fact, it was the highest (least negative) spread since the end of March 2009. Since then, the Baa corporate yield has increased more sharply than have Equity REIT dividend yields, which brought the spread down to -0.87% as of the end of 2016—still in the top 23% of yield spreads seen during the modern REIT era. In other words, even after the corporate bond market took a beating during the last two months of 2016 (raising bond yields significantly) the REIT dividend yield spread remains uncommonly wide, in an uncommonly bullish part of its historical range. As Chart 1 shows, over the 26 years of the modern REIT era, when the industry-aggregate dividend yield spread to Baa corporates finished a month in the range of -1.1% to -0.6% total returns over the next two years averaged 18.3% per year (with a median of 20.1% per year).
As with Treasuries, the relationship between Baa corporate yield spreads and two-year subsequent REIT returns can be modeled with a simple regression relationship that suggests that, since December 1990, two-year average total returns have tended to be about 26.14% plus 10.24 times the yield spread at the beginning of the period. (Note: I also modeled returns over the next one, three, four, and five years, and I’ll discuss those results.) The relationship “explained” forward-looking average total returns reasonably well, with an R-squared of 30%. If that regression relationship continues to hold over the next two years, the yield spread at the end of 2016 suggests that total returns on exchange-traded Equity REITs would average about 17.3% per year.
As I noted in my previous commentary, the problem with estimating that sort of relationship using past data and then using it to guess the future is that our measures of its explanatory power, such as R-squared, are based only on how it “explained” past data, not on how successfully it would have guessed the future. To get a handle on that question I suggested estimating the relationship using old data, using it to guess a date that is in our past but would have been in the model’s future, and then recursively updating the model and its future-guesses to see how much the model changed and how accurate its future-guesses were.
To repeat the exercise that I did yesterday with Treasuries, let’s say that at the end of 1992, two years after the advent of the modern REIT era, I had used all of the data then available on the monthly dividend yield spreads from January 1972 to December 1990 (that is, over the 19 years of the “pre-modern era”) and on the total returns of exchange-traded Equity REITs over the subsequent two years (with the latest period ending in December 1992) to estimate the same sort of relationship. As time passed, each time one more month became available I could have dropped the oldest month, maintaining a rolling 19-year window and re-estimating the model. By the end of 2016 I would have estimated the relationship 289 times.
Now let’s use all 289 models to see what they would have future-guessed based on the end-of-2016 yield spread of -0.87%:
- The most bearish model was the one that used yield spreads from December 1979 to November 1998 and returns from November 1998 to November 2000, and based on the current spread of -0.87% it would future-guess returns averaging 9.20% per year over the next two years.
- The most bullish model used spreads from April 1994 to March 2013 and returns from March 2013 to March 2015, and based on the current spreads it would future-guess returns averaging 17.00% per year over the next two years.
- The most recent model used spreads from January 1996 to December 2014 and returns from December 2014 to December 2016: it says forward-looking total returns tended to be about 25.38% plus 10.35 times the beginning-of-period yield spread, and based on the current spread of -0.87% it would future-guess returns averaging 16.41% over the next two years.
- Half of all models would future-guess returns averaging between 12.38% and 16.31% over the next two years. (Another ¼ of models would imply guesses averaging less than 12.38% per year, and the remaining ¼ would imply guesses averaging more than 16.31% per year.)
As with Treasuries, using forward-looking returns measured over other periods (the next one year or the next three, four, or five years) just doesn’t make very much difference. For example, half of the one-year models (301 of them) provide future-guesses of total returns over the next year of between 12.52% and 17.08% based on today’s yield spread of -0.87%; the most recent model future-guesses 16.58%. The inter-quartile spreads for the three-year, four-year, and five-year models are 12.07%-14.81% per year, 11.71%-13.90% per year, and 12.02%-13.53% per year over those respective future periods, and the most recent models future-guess returns of 16.58% over the next one year, 14.58% per year over the next three years, 13.25% per year over the next four years, and 12.54% per year over the next five years.
As with any exercise of this general sort, past returns are no guarantee of future performance and the past relationship between the Equity REIT dividend yield spread to Baa corporates is no guarantee that the relationship will continue to hold in the future. The bottom line, though, is similar to what I concluded in my previous commentary: the yield spread to Baa corporates as of the end of 2016 was in the bullish part of its historic range—and if a wide variety of estimates of the past relationship between spreads and forward-looking returns continues to hold, that currently bullish spread would suggest relatively bullish future total returns for investors in exchange-traded Equity REITs, in the range of something like 12.5% to 17.1% over the next one year and 12.05% to 13.5% per year on average over the next five years.