.jpg)
At the beginning of 2018 REITs were undervalued and poised for outperformance. At the end of the year both statements were still true—but less so, because the outperformance has begun.
Investors can be excused if they forget about 2018 entirely: through mid-December total returns in the broad U.S. stock market were slightly negative at -1.7 percent, while REIT returns were positive but equally forgettable at +2.6 percent. That tepid summary of the year, though, masks what I consider to be two important developments: the end of a tech stock “bubblet” and the beginning of a rediscovery of companies with more favorable valuations, including REITs.
I haven’t mentioned the role of interest rates precisely because, contrary to the market consensus, I don’t believe they played a very important role. My view is that the fact that REITs were underperforming the broad stock market, during a period when interest rates were generally rising, led REIT-focused investors to an incorrect diagnosis of market dynamics. In my opinion, the underperformance of REITs over the past two years has not been about the effect of interest rates on real estate values, but about “irrational exuberance” regarding future earnings growth for already-overvalued companies, especially tech companies.
My review and outlook focuses on three themes:
- The tech stock bubblet that had begun in late 2016 seems to have ended early in 2018.
- REITs held their own during most of 2018 as investors came to terms with fundamental market conditions and started to shift from a bubble mentality toward a value-seeking mentality.
- Current valuations and underlying operating fundamentals have REITs set up for strong ongoing performance as that shift toward a value-seeking mentality continues to play out.
Early 2018: The End of the Tech Stock Bubblet
During 2017 the top-performing sector of the market, by far, was info tech stocks: the S&P 500 Information Technology sector index returned a whopping 38.8 percent, beating the runner-up sector by 15 percentage points. The beginning of 2018 extended that streak: by the middle of March the Info Tech sector index had returned 53.4 percent over 14½ months, as shown in Graph 1.
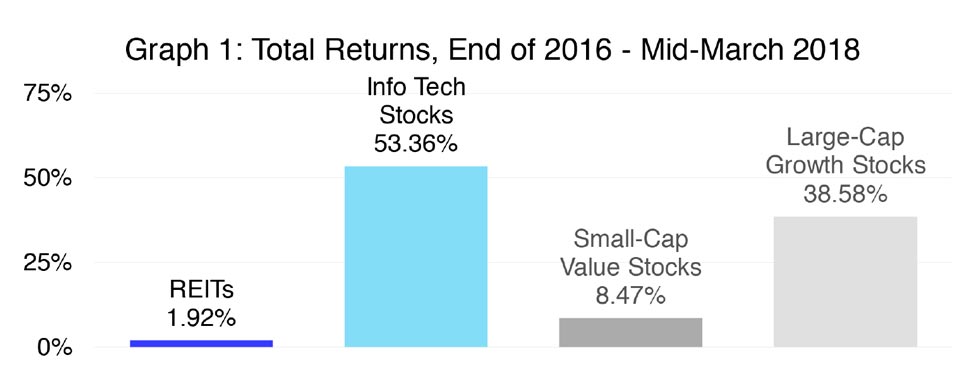
Attention locked particularly on to the FAANG stocks (Facebook, Apple, Amazon, Netflix and Google, owned by Alphabet), all of which are popularly thought of as tech stocks although Amazon and Netflix were officially classified in the S&P Consumer Discretionary sector. In fact, 2017 and early 2018 could be thought of more generally as a large-cap growth stock bubblet: the Russell 1000 Growth index of large-cap growth stocks—including all of the FAANGs—returned 38.6 percent and outperformed the Russell 2000 Value index of small-cap value stocks by more than 30 percentage points.
Two long-term truths are worth keeping in mind. First, growth stocks are essentially defined as overvalued companies that should generally be expected to underperform going forward. Second, large-cap growth stocks have typically underperformed small-cap value stocks—a segment that includes many REITs and historically has been the part of the stock market most similar to the REIT market—by a large margin: in fact, data published by the economist Kenneth French (half of the famed Fama-French team of stock market researchers) shows that total returns for small-cap value stocks have averaged 25.1 percent per year over the past 92¼ years, nearly double the average for large-cap growth stocks.
Most of 2018: The Pause That Reboots
I published a market commentary at the end of April noting an interesting recent development: stock market volatility had spiked in March and remained elevated during April , which I suggested might be a signal that stock market investors were becoming less certain that their aggressive expectations for future earnings growth among FAANG and other large-cap growth stocks were still realistic.
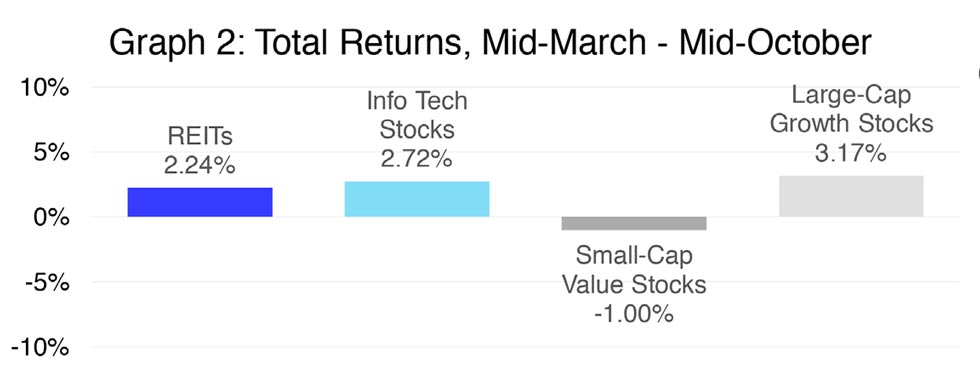
To be sure, some investors pushed ahead, with a new bubble-mentality slogan (“buy on the dips!”) that would have been worthy of the Light Brigade. The exuberance of those investors, though, was countered by others who adopted a more thoughtful approach—with the result that returns in the different segments of the market were remarkably balanced during the seven months from mid-March to mid-October, as shown in Graph 2.
As you can see, investors didn’t become pessimistic—just more circumspect. I would say that was the sensible posture: the outlook for macroeconomic growth continues to be favorable, but also continues to be more sober than the gung-ho investors of 2017 and early 2018 hoped. In such an environment—when the most important uncertainty is not whether the macro expansion is likely to continue but rather whether it will be headlong or more sustainably paced—it makes sense for investors to pause to take more careful stock of prospects and relative valuations.
Late 2018: The Long-Delayed REIT Reversion
What investors seem to have found during that pause for circumspection is the opportunity that their earlier inattention had created: while investors had been preoccupied not merely with tech stocks but also with private equity (including tech stocks’ illiquid cousins, venture capital) and even private-equity real estate, REITs had become one of the most undervalued segments of the investment market. Investors don’t ignore favorable opportunities forever, and the long-delayed reversion in relative valuations finally began in mid-October.
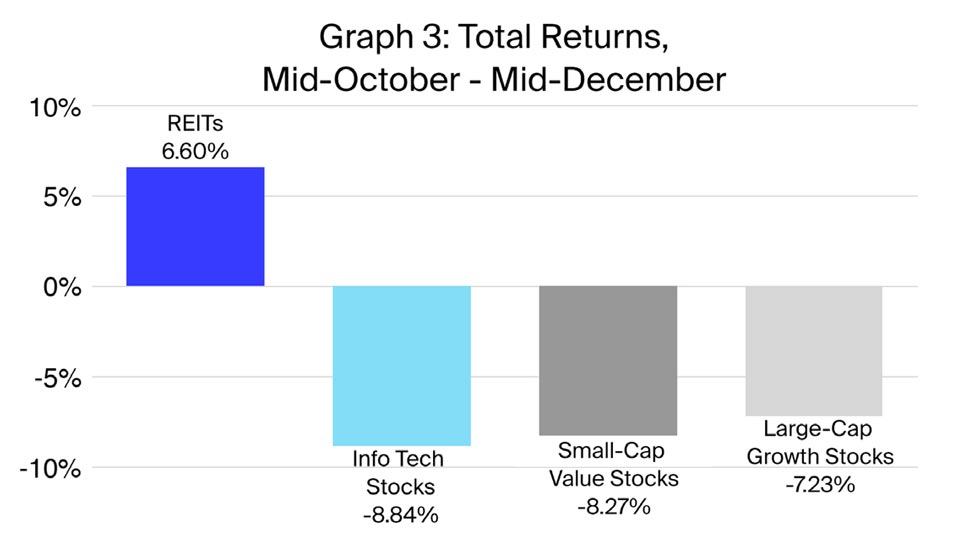
As Graph 3 shows, over the nine weeks ended December 14 the Info Tech sector lost nearly nine percent of its inflated value, while large-cap growth stocks more generally lost 7.23 percent. Even small-cap value stocks lost 8.27 percent over the same period. REITs, on the other hand, returned 6.60 percent, topping the Info Tech sector by 15.4 percentage points and outperforming every other sector of the S&P 500 except Utilities.
REIT Operating Environment: Still Solid and Still Promising
In my “2017 Review and 2018 Outlook” published at the beginning of 2018 I concluded that, “in short, the operating environment for REITs has been solid, both demand and supply drivers have been favorable, and I expect—most importantly—that a strong operating environment will persist through 2018, if not indeed for several more years to come.” One year later I would be comfortable writing exactly the same sentence, merely substituting 2019 for last year. In fact, very little has changed in terms of the favorable operating conditions that led me to the conclusion one year ago:
- Net operating income (NOI) from REIT-owned properties has continued to grow at a pace that is both strong and sustainable: according to Nareit’s T-Tracker® , same-store NOI has grown 2.82 percent over the past four quarters, still in what I called then a “sweet spot” of between 2.5 percent and 4 percent per year.
- The pace of new construction remains below the level of just over 1½ percent of GDP that was normal prior to the construction collapse that began in 2008: in fact, it hasn’t budged at all from where it was a year ago—at just 1.34 percent of GDP, down from a recent high of just 1.39 percent at the end of 2016.
- The average occupancy rate at REIT-owned properties has actually increased from 93.97 percent a year ago to 94.29 percent—literally the highest average that has ever been recorded, in a data series going back to the first quarter of 2000. And the occupancy rate for REIT-owned retail properties is even higher at 95.43 percent.
At the same time REITs have managed their balance sheets prudently, ensuring that they will be able to access the capital markets on favorable terms when they identify opportunities to create value. In particular, according to the T-Tracker, REITs use less debt now than they have at any time since the 2000Q1 start of the historical data series, regardless of whether debt is measured relative to the implied market value of their assets (32.68 percent) or relative to book value (47.9 percent). Their weighted average interest rate on long-term debt (4.06 percent) has never been lower, nor has interest expense relative to NOI (20.8 percent). Clearly the REIT capital environment, like the REIT operating environment, remains both solid and promising.
2019 Outlook: Continued REIT Outperformance
As I noted last year, historically the spread between REIT dividend yields and the yields on other income-oriented investments has remained remarkably consistent, and those spreads have proved equally remarkable as a signal of future REIT returns. Daily data since the beginning of 1999 shows that the yield on Baa-rated U.S. corporate bonds has usually remained between 100 and 200 basis points higher than the dividend yield on U.S. REITs. When the yield spread has been within that normal range, REIT total returns have averaged 13.1 percent over the next 12 months and 8.6 percent per year over the next five years.
Over the same historical period, when the spread was uncommonly large—greater than 200 basis points—REIT total returns have been uncommonly low with an average of just 1.7 percent over the next 12 months and 5.7 percent per year over the next five years. In contrast, uncommonly small yield spreads—less than 100 basis points, including those rare situations in which REIT yields have been higher than Baa-rated bond yields—have generally signaled especially strong future REIT total returns: historically they’ve averaged 18.4 percent over the next 12 months and 17.4 percent per year over the next five years.
At the beginning of 2018 the spread was uncommonly narrow at just 0.23 percent, hinting that REIT returns were likely to be very strong over the next few years. Over the first few weeks of the year the spread became even narrower: in fact, on February 8 the yield spread closed to zero, an extreme signal of REIT undervaluation that we hadn’t seen since April 1, 2009. (REIT returns following that date were indeed strong at +110% over the next year!)
As Graph 4 shows, however, the REIT dividend yield spread to Baa-rated corporate bonds has widened (become more negative) since those radically undervalued days in February and early March. Part of the reason is that corporate bond prices have declined, increasing the Baa yield from 4.48 percent on February 8 to 5.14 percent as of December 14. The other part of it, though, is that REIT stock prices have increased, causing the REIT dividend yield to decline from the same 4.48 percent on February 8 to 4.02 percent on December 14.
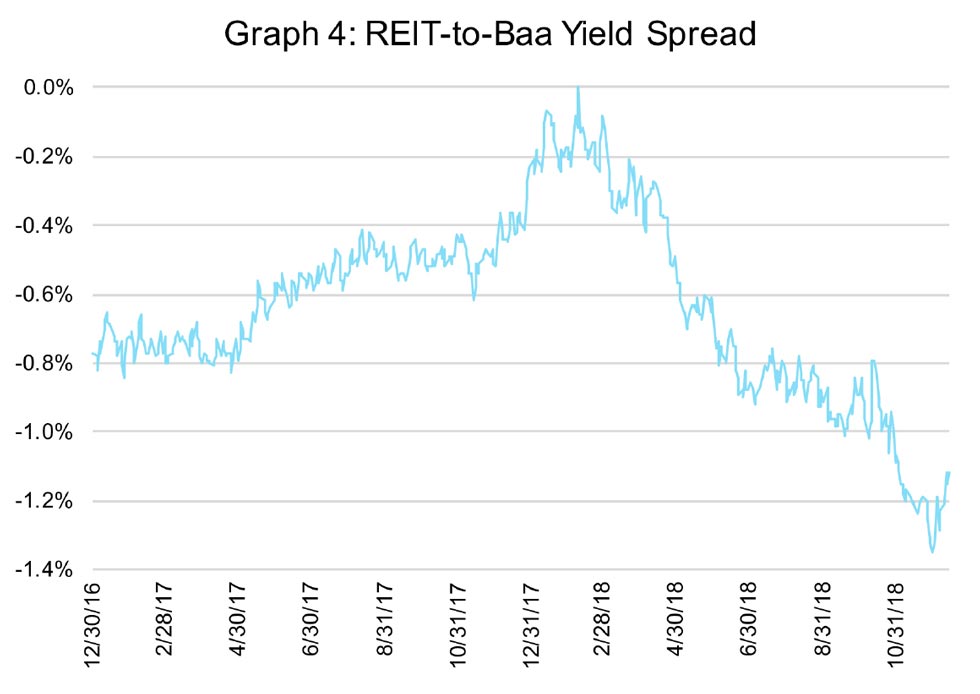
As I noted, historically the yield spread has most frequently been between 100 and 200 basis points, with a median of 125 basis points—which means that, if the signal isn’t as bullish now as it was early in the year, at least it’s still on the bullish side of its normal range. In fact, regressing historical daily yield spreads (since the end of 1998) on total returns over the next year suggests that, if the historical relationship continues to hold and given the yield spread of 1.12 percent on December 14, REIT investors can still anticipate total returns of close to 14 percent during 2019 and can still anticipate outperforming the broad stock market by something like 5.8 percentage points, as shown in Graph 5.
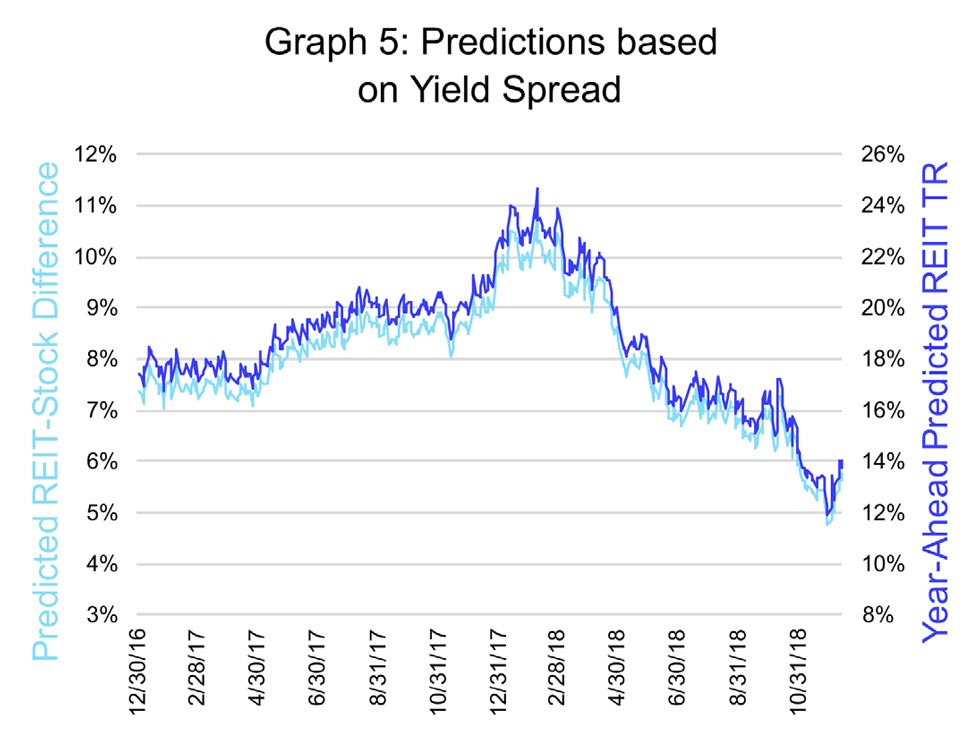
Of course there are no guarantees in investing, so the point estimates shown in Chart 5 are not the important takeaway of this outlook. Instead, what investors should take away is simply this:
- First, the tech-stock bubblet that was drawing attention away from investment opportunities in REIT space seems to have ended early in 2018.
- Second, REIT operating fundamentals have been favorable, continue to be favorable, and will likely remain favorable not merely through 2019 but probably for several more years thereafter.
- Third, investors seem to have rediscovered REITs during late 2018—that is, the inevitable reversion of the market away from overvalued segments and back into undervalued segments has begun.
- Fourth, although REITs are no longer the screaming bargains that they were in February, valuation metrics still place them firmly on the bullish side, suggesting that they are likely to outperform the broad stock market over the next few years.
May 2019 be a successful year for you.
More 2019 REIT Outlook