
Commercial Real Estate and REITs: Dual Divergences Set Stage for REIT Rebound in 2026
Key Takeaways
- REITs delivered resilient operating performance and maintained reliable access to capital markets during a volatile and disruptive 2025.
- REITs’ disciplined balance sheets and low debt costs position them for continued growth in 2026.
- Going into 2026, REITs are experiencing two divergences: a prolonged gap between public-private real estate valuations and a dramatic, persistent divide between REIT and broader equity valuation multiples.
- It’s a question of when, not if, these divergences end, and based on past cycles, the coming convergences will likely favor REIT outperformance.
- As markets converge and transactions increase, REITs are well-positioned to make acquisitions and benefit from accretive growth
The Rise and Fall of Economic and Financial Market Uncertainty
Throughout 2025, the economy and financial markets experienced significant uncertainty and volatility, largely driven by concerns over changes in U.S. trade policy, the nation’s fiscal sustainability, geopolitical tensions, and the federal government shutdown. After a period of turbulence, the marketplace seems to be more stable. As broad uncertainty measures have returned to beginning-of-year levels, financial markets appear to have priced in less economic turmoil going forward.

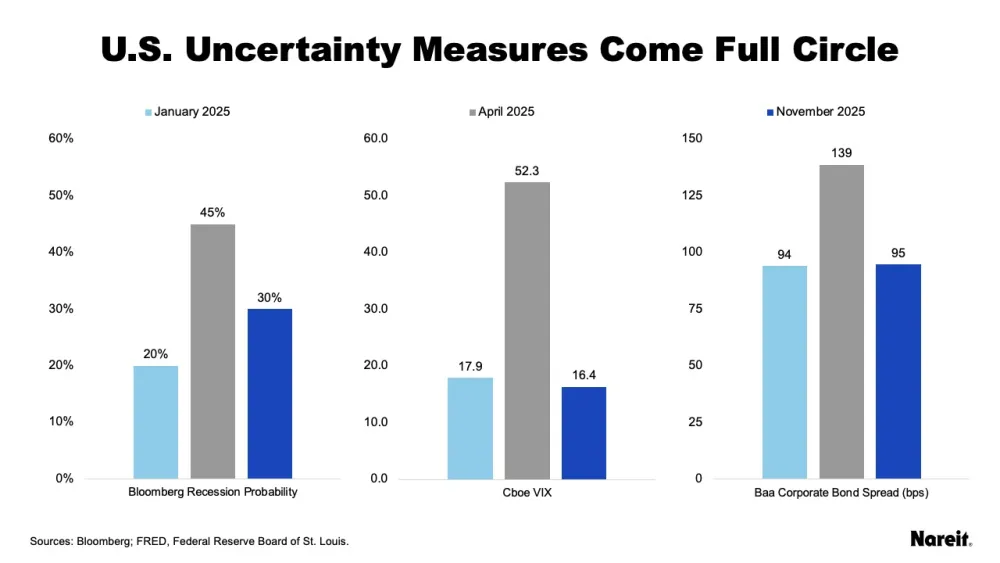
The charts above exhibit the Bloomberg Consensus Forecast Survey’s probability of a recession in 12 months, the Cboe VIX Index, and the Baa corporate bond yield spread over 10-year Treasuries for January 2025, April 2025 (post-Liberation Day peaks), and November 2025. The VIX, often referred to as the “fear index,” tends to rise with increased market stress. Baa is the lowest investment grade corporate bond rating and its spread over Treasuries captures perceived bond market risk, with wider spreads reflecting increased risk.
Each uncertainty measure started the year at a low level, reached its maximum level post-Liberation Day, and then fell as investors and markets became more comfortable with the prevailing environment.
While uncertainty metrics may have come full circle in 2025, some indicators suggest that the U.S. economy may be slowing. A softening job situation and modestly rising inflation motivated the Federal Open Market Committee to reduce its target policy rate range by 25 basis points (bps) to 3.75% to 4.00% at its October 2025 meeting. Looking forward, federal data reporting delays related to the government shutdown may limit clarity, but available public and private data sources still suggest that the economic outlook, while weakening, does not likely portend a significant slowdown.
REITs have continued to deliver solid operational performance and maintained well-structured balance sheets with low leverage.
REIT Fundamentals Remain Strong
In challenging economic and financial market conditions, REITs have continued to deliver solid operational performance and maintained well-structured balance sheets with low leverage. While this has been a consistent theme over the past several years, it has been underappreciated by investors.
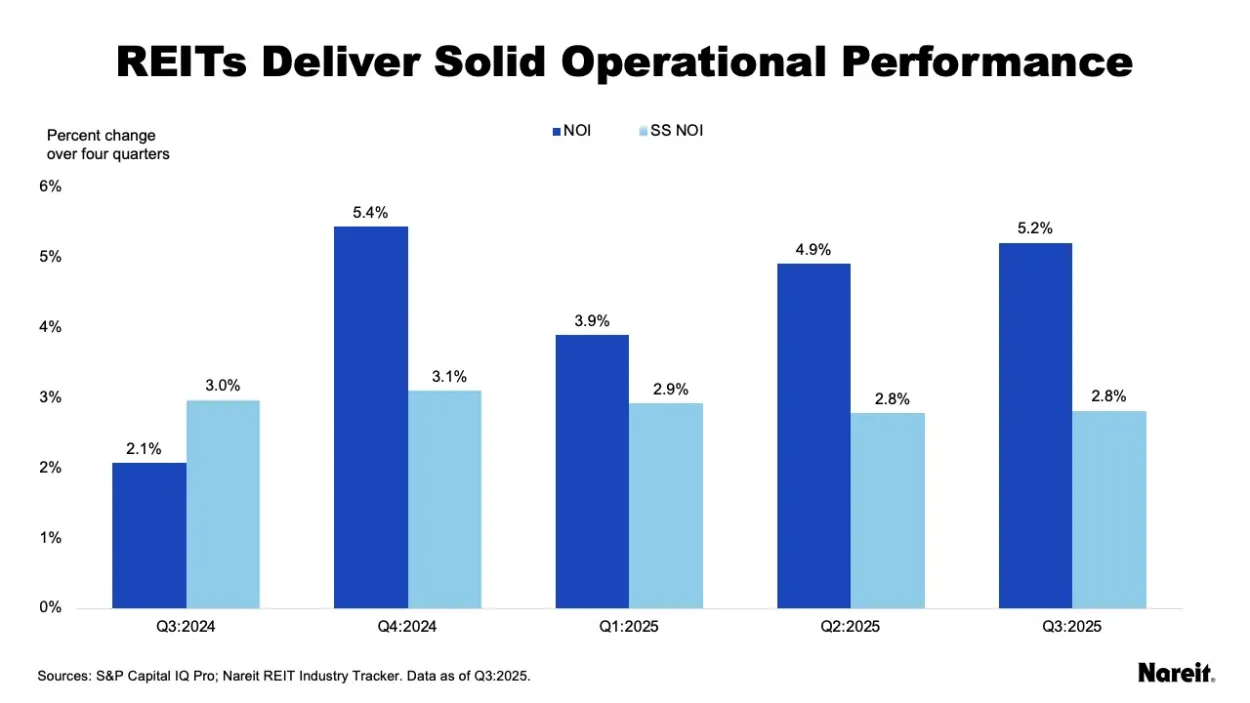

The chart above presents quarterly year-over-year net operating income (NOI) and same-store net operating income (SS NOI) growth rates for U.S. public equity REITs from the third quarter of 2024 to the third quarter of 2025.
As of the third quarter, REIT year-over-year NOI and SS NOI growth rates were 5.2% and 2.8%, respectively. More than 60% of REITs posted positive year-over-year NOI growth rates; more than 50% had year-over-year SS NOI gains. Continued solid operational performance in a challenging market is a testament to REITs’ asset selection and management expertise.

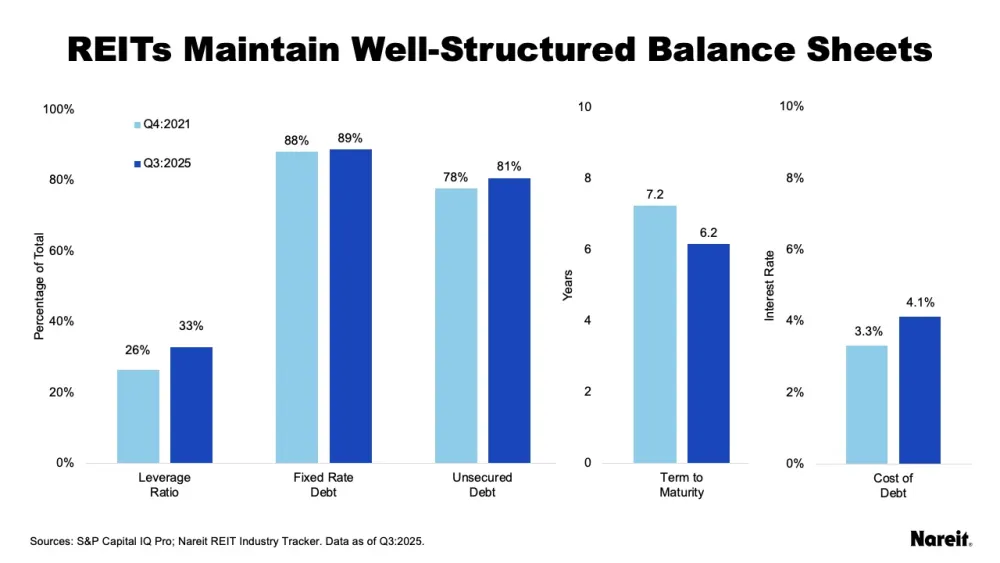
Using data from Nareit’s quarterly REIT Industry Tracker the chart above shows REIT balance sheet metrics for the fourth quarter of 2021 and the third quarter of 2025. The data from the fourth quarter of 2021 showcases the state of REIT balance sheets before the surge in the 10-year Treasury yield in 2022. Since then, interest rates have remained elevated.
In difficult times, the strength of a company’s balance sheet often takes center stage. Across the two time periods, REITs have proven to be excellent stewards of their balance sheets. REITs’ emphasis on fixed rate debt and longer terms to maturity have limited their exposure to higher interest rates and highlighted their focus on long-term investment. Access to unsecured debt has also provided REITs with a competitive advantage, while low debt costs have afforded them considerable operational flexibility to address property and firm needs.
Dual Divergences Set the Stage for REITs in 2026
REITs are currently experiencing dual divergences. Public and private real estate values have reached a record long cycle of divergence that began in 2022, when interest rates rose dramatically. Starting in 2023, a striking divergence between REIT and broader equity valuations emerged, driven largely by the outperformance of AI-linked tech stocks. Each of these divergences may individually set the stage for REIT relative outperformance and growth in 2026 and beyond.
Public-Private Real Estate Valuation Divergence Could Close in 2026
Historical data indicate that public and private real estate valuations have reached their longest period of divergence. The public-private real estate cap rate spread has been slow to close and remains wide; it stood at 112 bps in the third quarter of 2025. While the market-driven REIT implied and private transaction cap rates have essentially been in sync with one another, private appraisal cap rates seem entirely disconnected from transaction markets, maintaining only a slight premium to the 10-year Treasury yield.


The chart above displays the maximum public-private cap rate spreads and peak-to-trough durations measured in quarters for the four major property valuation divergences since 2000. It shows that:
- The 2000 and 2009 real estate valuation divergences occurred during the dot-com bust and global financial crisis, respectively. Both dislocations had significantly higher peak cap rate spreads, but shorter convergence times than their successors.
- The 2018 and 2022 dislocations may have been milder, but both tended to linger. The 2018 divergence spanned a brief recession, but its convergence was probably postponed by COVID-19; its return to equilibrium took 12 months.
- The current valuation divergence sparked by the 2022 surge in the 10-year Treasury has now reached the record of 12 months. Public-private cap rate spreads are narrowing but still exceed 100 bps—suggesting convergence may be approaching in 2026, though the dislocation is not over yet.
As public and private real estate values become more aligned, a revival in today’s anemic property transaction market is anticipated. While the public-private real estate valuation convergence appears to be on the horizon, real estate transaction volume data have already highlighted an uptick in recent activity.
REIT-Equity Market Valuation Divergence Presents Buying Opportunity
The second divergence is between the broad equity market and REIT valuation multiples. The recent strong performance of the U.S. equity market relative to REITs—driven in large part by the outperformance of AI-linked tech stocks—has resulted in equity valuation multiples soaring above similar REIT metrics. While this type of dislocation has been uncommon, history shows that as these metrics move back toward equilibrium, REITs have tended to outperform broad equities.
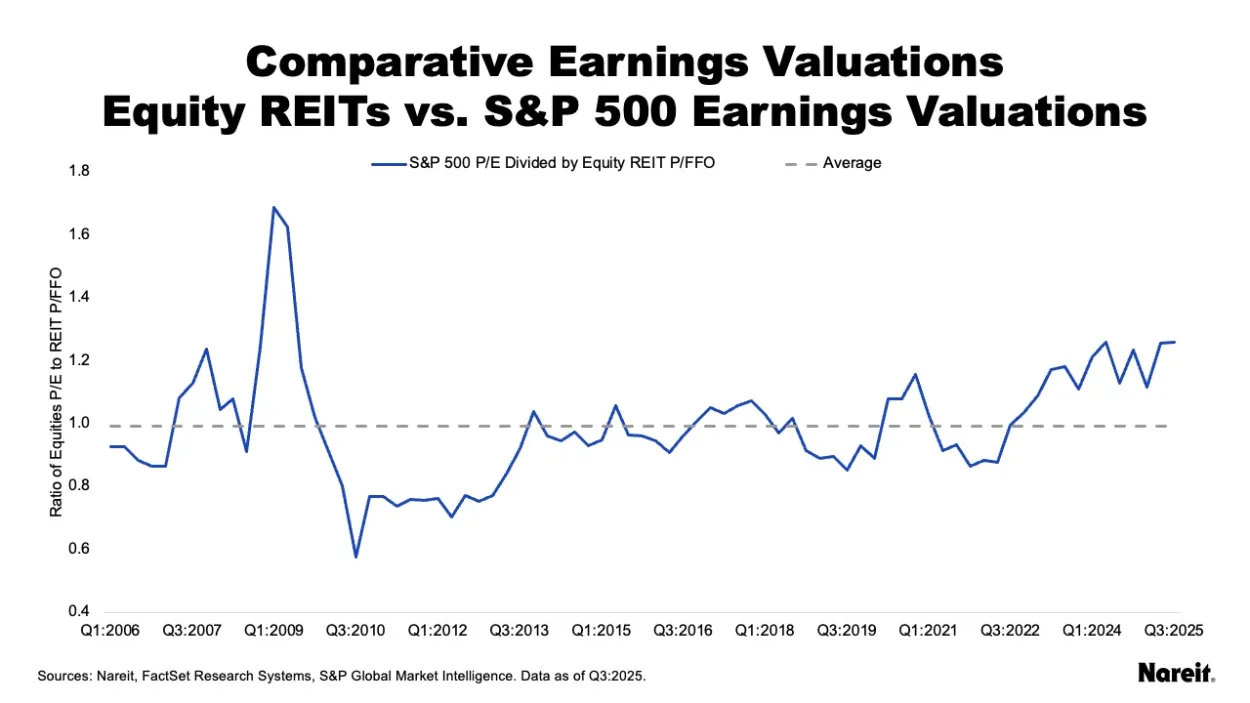
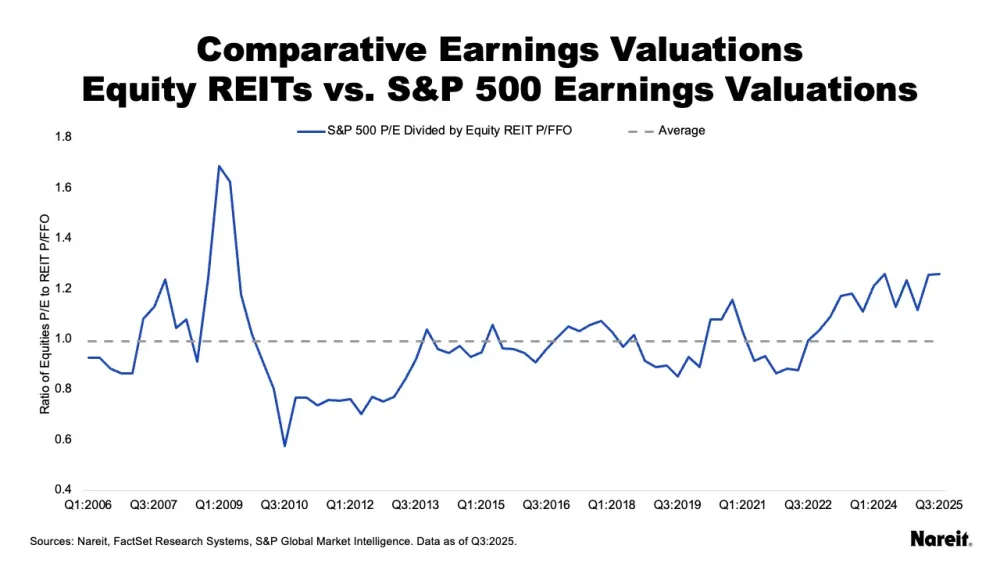
The chart above depicts the S&P 500 forward (next 12 months) price to earnings ratio (P/E) divided by the equity REIT forward price to funds from operations ratio (P/FFO). It also shows an average of the valuation quotients since the first quarter of 2006. Valuation quotients greater than 1 indicate that equity multiples were greater than REIT multiples, and vice versa.
REITs have tended to outperform broad equities as the gap between the valuation multiple metrics closes.
Since 2006, the average ratio of the S&P 500 P/E to equity REIT P/FFO has essentially been 1. This ratio was significantly elevated during three periods: the global financial crisis, the COVID-19 pandemic, and the recent AI-driven tech rally. These dislocations have traditionally presented buying opportunities for REIT investors. While past performance is not indicative of future results,REITs have tended to outperform broad equities as the gap between the valuation multiple metrics closes. For example:
- During the global financial crisis, the broad equity-REIT valuation ratio peaked at 1.7 in the first quarter of 2009. Four quarters later, it was 0.9. That is because during this period, the FTSE Nareit All Equity REIT index posted a total return of 106.7% while the S&P 500 gained 49.8%. REITs outperformed broad equities by 56.9%.
- During the COVID-19 pandemic, the broad equity-REIT valuation ratio peaked at 1.2 in the fourth quarter of 2020; it was 0.9 by the fourth quarter of 2021. Over that time, the FTSE Nareit All Equity REIT and S&P 500 indices posted total returns of 41.3% and 28.7%, respectively, resulting in REITs outperforming by 12.6%.
- Along with the current AI-related tech rally, the broad equity-REIT valuation ratio started to rise during 2023. Although the ratio has fluctuated, it has remained elevated; it stood at 1.3 in the third quarter of 2025. Similar to the current public-private real estate divergence, this broad equity-REIT valuation dislocation has lingered.
Dual Convergences and the Promise for REITs
While it is difficult to time the end of a market dislocation, historically both types of divergences have had their own convergences which were marked by REIT relative outperformance. Although the length of the REIT–equity dislocation is still unknown, the potential tightening of the public-private cap rate gap in 2026, combined with rising transaction activity, point to a possible valuation convergence ahead.

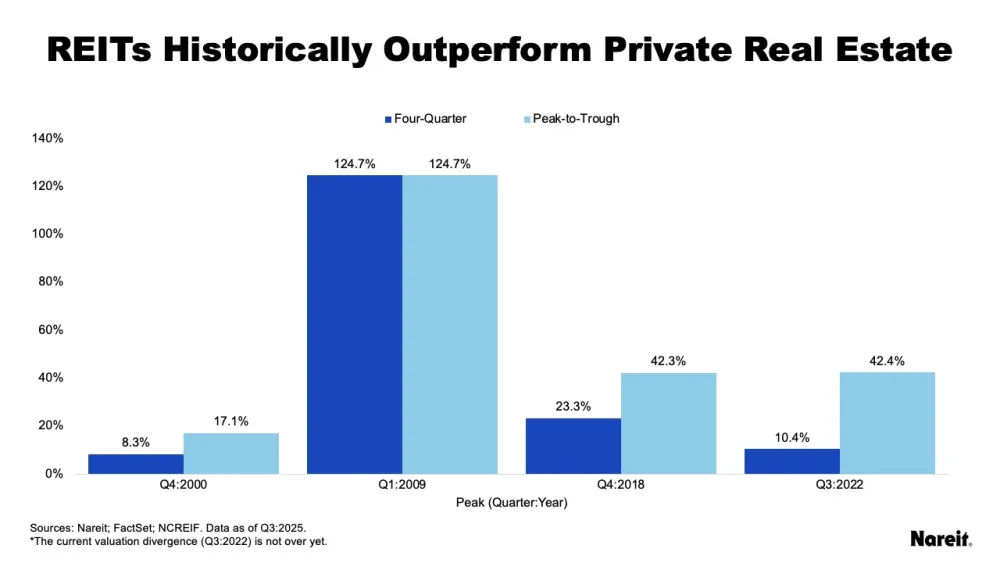
The chart above presents four-quarter and peak-to-trough total return differences between public and private real estate after each of the four major cap rate spread peaks. Total return differences were calculated using FTSE Nareit All Equity Index (FTSE Nareit) and National Council of Real Estate Investment Fiduciaries Fund Index–Open End Diversified Core Equity (NFI–ODCE) data. Positive values indicate REIT outperformance. All performance metrics reflect cumulative total returns. Note that the current divergence (Q3:2022) is not yet over.
After each of the four major peaks, REITs outperformed private real estate on both four-quarter and peak-to-trough total return bases. The four-quarter REIT total return outperformance ranged from 8.3% to 124.7% and averaged 41.7%. The peak-to-trough REIT outperformance ranged from 17.1% to 124.7% and averaged 56.6%.
REITs Positioned for Growth in 2026
When property valuations converge and the transaction market regains its footing, REITs are poised to be in an enviable position on the acquisitions front. With private real estate capital raising in the doldrums and bank financing constrained, REITs’ disciplined balance sheets and reliable access to capital—through debt, equity, and other forms of financing like joint ventures with large institutional investors—will provide important distinctions in the marketplace. Taken together, these strengths position REITs to enter a growth cycle in 2026.