
Optimizing Returns Through a Global Lens
Key Takeaways
- Nareit expects investors to increasingly recognize the foundational role global REITs and publicly-listed real estate play in the modern economy.
- REITs and listed real estate give investors the liquidity and ability to target global regions or sectors—and to instantaneously refine their strategies.
- In 2025, active managers of real estate funds reduced their overall exposure to North America and favored the diversified sector in Asia and the retail sector in Europe.
- Active managers will continue to strategically allocate investments in growing economies with strong real estate fundamentals in 2026.
Many institutional and individual investors have remained confined by a familiar trap: home bias—a tendency to overweight domestic markets even when global opportunities offer stronger fundamentals, diversification, and resilience.
Global REITs and publicly listed real estate challenge that instinct. REITs are liquid and transparent, enabling investors to nimbly build global strategies that reflect real economic activity rather than geographic comfort zones. The following analysis of listed real estate markets presents a powerful case for looking beyond domestic borders. It also includes findings from Nareit’s global active managers tracker, which shows that active managers of real estate funds are reducing their exposure to the Americas in favor of sector and regional opportunities in Europe and Asia. Returns data used in this analysis are as of Nov. 30, 2025, and are in U.S. dollars (USD) unless otherwise noted.
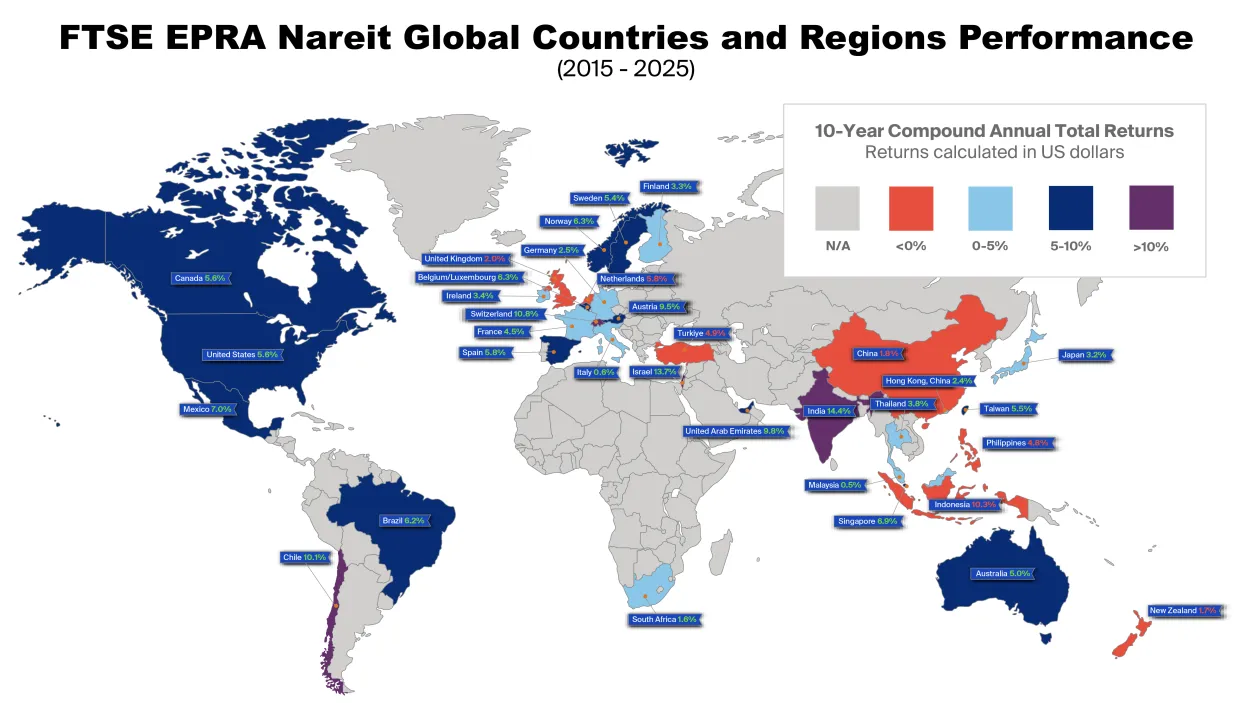

As reflected in the map above, the FTSE EPRA Nareit Global Real Estate Index tracks the returns of real estate companies in all regions, illustrating how real estate markets perform differently around the world. Year-to-date in 2025, the FTSE EPRA Nareit Developed Extended Index has returned 10.6%. Over the past decade, global real estate has demonstrated resilience. Companies and investors alike have had to navigate major challenges, including the global disruption of COVID-19, the rising interest rates that followed, heightened geopolitical tensions, and the recent ongoing uncertainty around global trade policies. Despite those headwinds, global real estate remains narrowly positive, with the FTSE EPRA Nareit Developed Extended Index posting a 10-year compound annual total return of 4.9%.

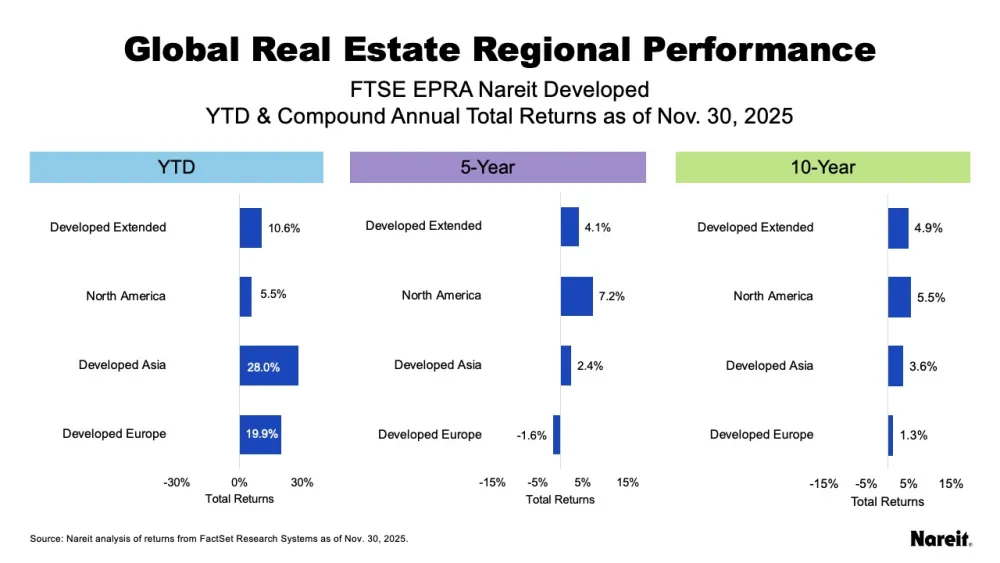
On a regional basis, the chart above shows that over the past decade, North America led with a total return of 5.5%, followed by Developed Asia (3.6%), and Developed Europe (1.3%).
Ultimately, the ability of publicly-listed REITs and real estate to sustain growth over the past decade highlights their durability, even in challenging conditions.
Tariffs, Macro Policy, and Currency Adjustments Define 2025 Returns
Trade disputes defined the first six months of 2025, fueling market volatility. Though the disputes stabilized in the second half of the year, uncertainty still lingers. Notably, global real estate remained positive in the face of trade uncertainty but lagged global equities.
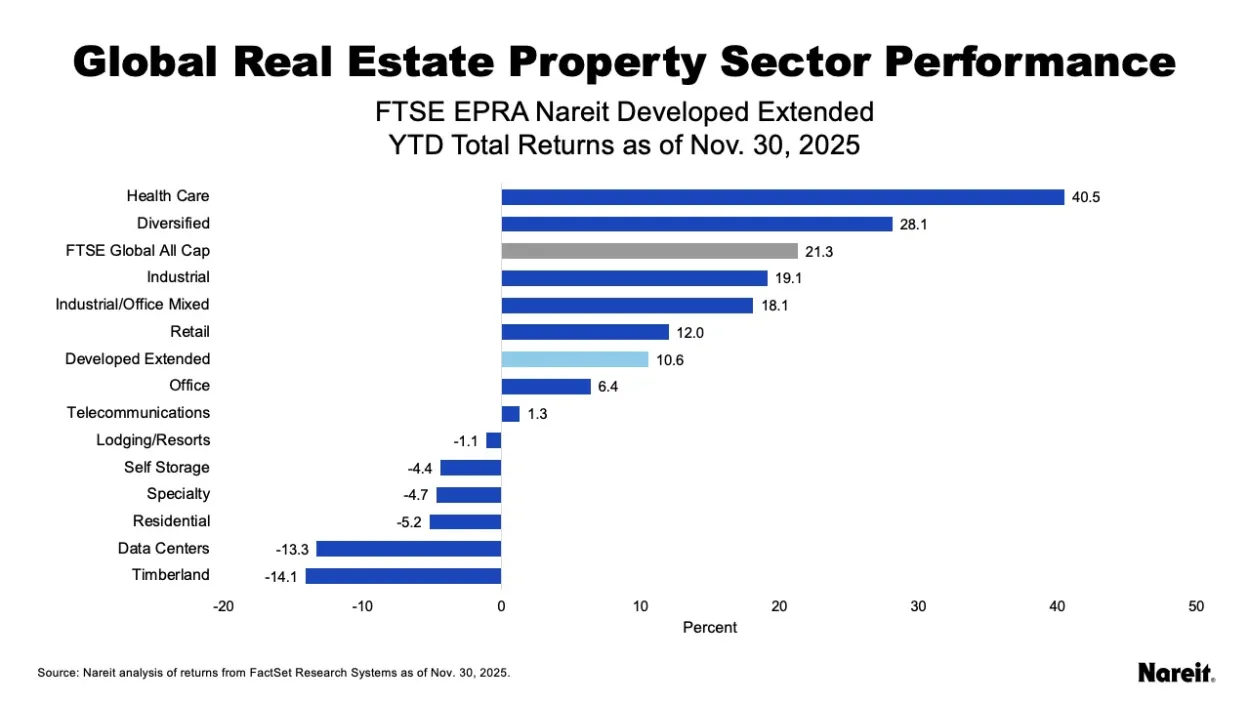

This performance gap is reflected in the chart above; the FTSE EPRA Nareit Developed Extended Index rose 10.6% as of Nov. 30, 2025, while the FTSE Global All Cap gained 21.3%. At the sector level, health care (40.5%) led global real estate, following by diversified (28.1%).
The latter half of the year also saw the Federal Reserve shift its strategy from holding rates steady to a risk management phase of gradual easing, initiating a series of rate cuts to support a cooling labor market while inflation continued to moderate. Though further near-term rate cuts are not a foregone conclusion, the goal is to achieve a more neutral stance towards rate policy in 2026.
Currency movements have been a significant tailwind for U.S.-based investors in 2025. The USD has generally weakened against major currencies, including the euro and the British pound, which has bolstered the performance of international assets.

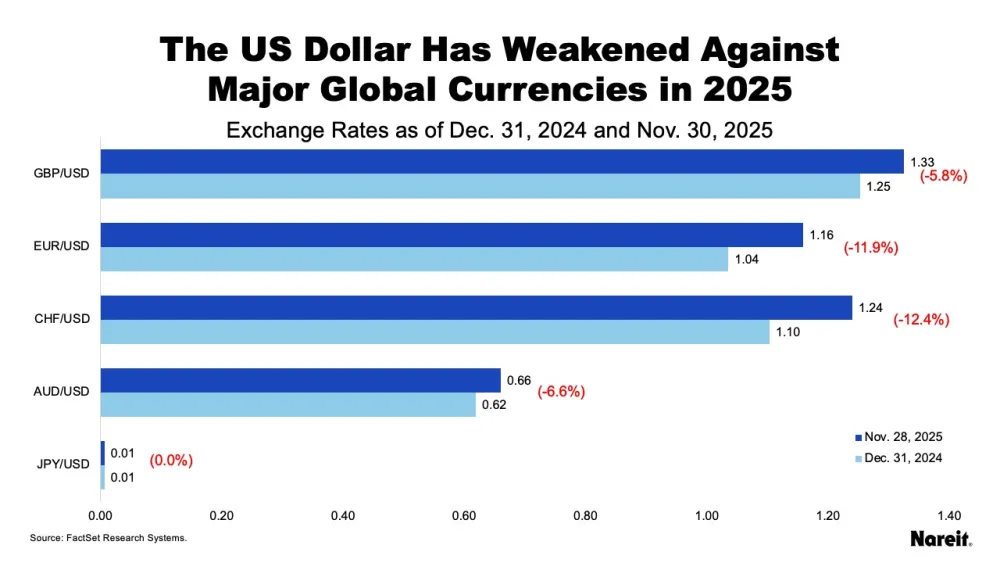
For U.S. investors, strong local returns in Developed Asia and Developed Europe were further boosted when translated back into dollars, which widened the performance gap with North America. As reflected in the chart above, the USD has fallen 11.9% against the euro, 5.8% against the pound, and is flat against the yen.
An Unusual Year for Regional Performance
The effect of tariffs on the dollar’s strength created an atypical year for regional performance with Asia leading, followed by Europe and North America.

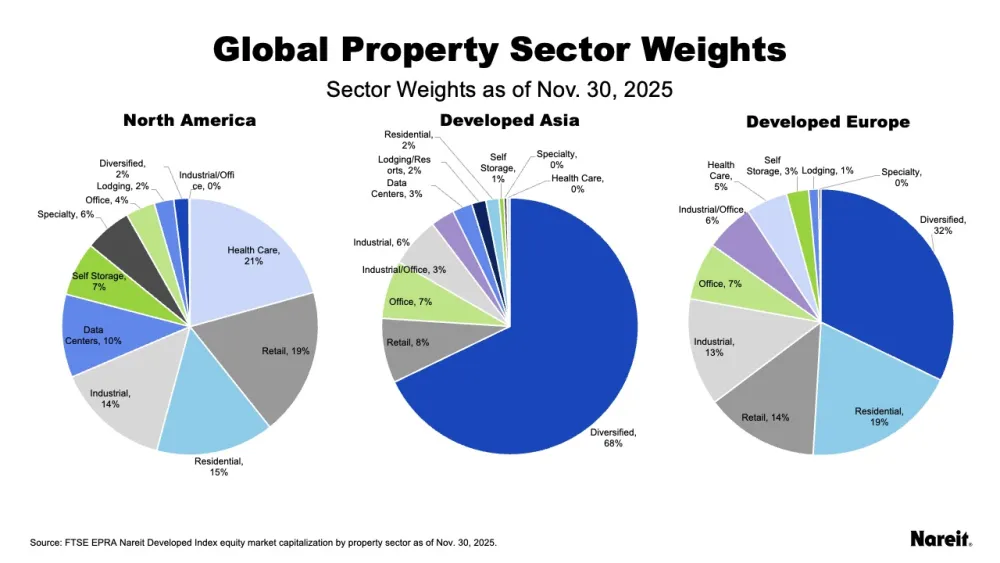
The chart highlights notable differences in regional sector composition. Developed Asia and Developed Europe are much more concentrated, with a large share of their markets in the diversified sector. In contrast, North America’s market is far more balanced; the diversified sector accounts for just 2% of the region, and no other sector accounts for more than 21%. This broader distribution provides important context for the following variations in sector performance across regions.


Asia's Concentrated Strength
As reflected in the year-to-date (YTD) chart above, Developed Asia delivered total returns of 28.0% (27.1% in Yen). Notably, this performance is highly concentrated. The diversified sector, which accounts for 67.9% of the region's market cap, delivered returns of 29.7% (28.8% in yen). In short, Asia’s performance is tied closely to the strength of its diversified sector.
Europe's Broad-Based Boom
Developed Europe, which rose 19.9% (7.0% in euros), showed broad strength. Unlike Asia-Pacific’s concentrated outcome, Europe's gains came from across various sectors. Health care surged 44.9% (29.3% in euros) and retail climbed 40.4% (25.3% in euros). Importantly, the region's largest sectors also delivered strong gains. Diversified, making up 32% of the region, returned 24.4% (11.0% in euros), and retail, making up 14% of the region, returned approximately 40% (25% in euros), as noted earlier in the paragraph.
North America’s Varied Sector Performance
With a 5.5% YTD total return, North America’s performance has significantly lagged the other regions in the index, and those returns were more varied than the other regions. Health care, the largest sector in the region, climbed 40.3% in 2025, followed by industrial/office mixed (26.4%), and diversified (20.0%). The latter two sectors only represent 2% of North America’s market; in contrast, data centers, which is 10% of the region, declined 14.1% in 2025. Notably, these results highlight the outsized impact of sector weights, rather than just sector strength alone.
Active Manager Allocations Offer Insight into Global Real Estate Trends
Actively managed funds specializing in global real estate provide a unique outlook on the use of global real estate. The largest 25 funds had more than $17 billion in assets under management (AUM), invested in 34 countries and regions, in the third quarter of 2025.

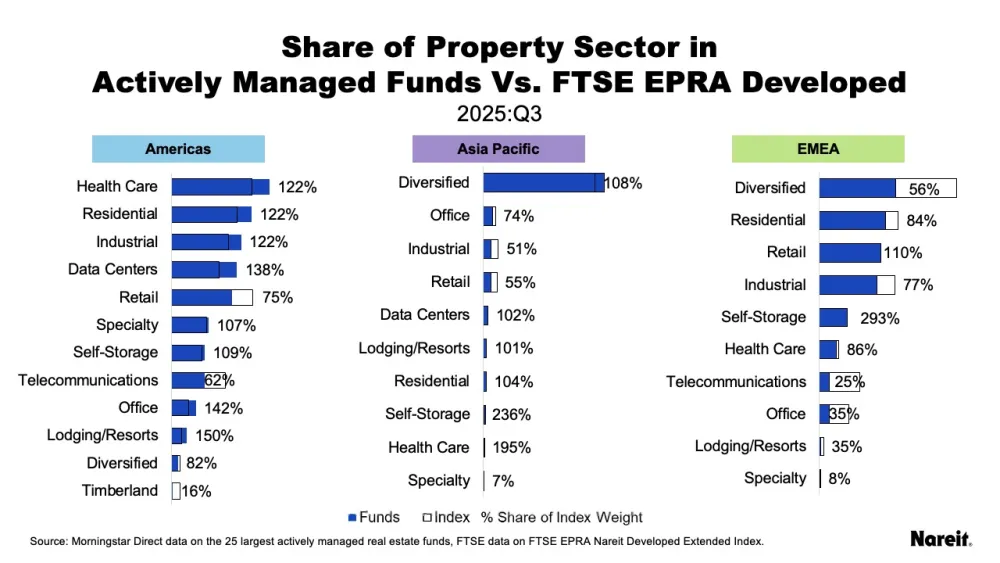
The chart above shows the property sector weights in each region in the largest actively managed funds (blue bars), the FTSE EPRA Nareit Developed Extended Index (black outline bars), and the share of the index weight in the funds as the percentages for the third quarter of 2025. Analysis of the chart reveals active managers’ sector allocations on a regional and global basis.
Regional Sectors: A Story of Selective Conviction
Nareit’s analysis of the chart shows that active global real estate managers are selectively shifting capital across regions based on sector strength rather than geography alone.
Americas: Actively Managed Funds Overweight Health Care, Residential
Active managers maintained a heavy tilt toward the Americas, which represents 71% of actively managed portfolios compared with 67% of the index. Within the region, allocations are concentrated in health care, residential, industrial, and data centers, which are all meaningfully overweight relative to their index weights. Lodging/resorts stands out as the most overweight sector at 150% of its benchmark share, followed by office at 142%.
Despite these strong tilts, managers have moderated their regional exposure. Weaker performance over the past year led to reduced allocations across eight of the 12 U.S. property sectors, resulting in a modest pullback in overall U.S. weightings.
Asia Pacific: Diversified Dominates
Active managers continued to concentrate assets in Asia Pacific’s diversified sector, largely mirroring the region’s prominence in the index. Strong performance in 2025 drove a 2.7 percentage point increase in actively managed allocations to Asia Pacific diversified REITs.
Although starting from much smaller base weights, active managers also favored self-storage, with allocations that were more than twice the sector’s index share, and health care, where allocations were at 195% of its index share. Overall, these allocation trends underscore that active managers increased their interest in a broader set of Asia Pacific sectors during the year.
EMEA: Small but Varied Allocations
Active managers remain broadly underweight to the EMEA region, with only two sectors showing overweight positions: self-storage, at 293% of its small index weight; and retail, at 110% of its benchmark share. Notably, retail in EMEA gained 0.5 percentage points over the year, making it one of the largest allocation increases across all regional sectors.
Global Sectors: A Story of Opportunity
While market-cap weighting tells one part of the story, the depth and breadth of global REITs and publicly listed real estate highlights a wealth of diverse opportunities. The top global performers, health care and diversified, illustrate this point clearly: both delivered strong performance across all three regions and saw increased allocations in actively managed global portfolios.
Conversely, the global returns for other sectors were shaped almost entirely by North America. The global residential sector’s 5.2% decline is largely the result of North America’s --7.4% performance. This fully offset Asia Pacific’s 18.0% gain, because the North American sector is more than 20 times larger than Asia Pacific. Although residential experienced the largest allocation reduction of the year, actively managed funds remain strongly overweight, underscoring their long-term confidence in the sector.
The same is true for data centers. The sector’s global return of -13.3% reflects North America's -14.1% decline, which outweighed the sector’s flat 0.1% gain in Asia Pacific. Active managers remained overweight in North American data centers despite reducing their positions by 1.2 percentage points for the year, while allocations in Asia Pacific aligned with index weights and experienced only a marginal increase.
Global REITs Can Optimize Returns
In 2025, uncertainties surrounding tariffs, exchange rates, and macro policy did not weaken global listed real estate; they created distinct regional sector opportunities, ranging from diversified in Asia to retail and health care in Europe. Active managers responded accordingly, strategically reallocating capital toward the regions and sectors with long-term fundamentals.
With liquid, transparent, and highly targeted access to property sectors around the world, REITs and listed real estate offer a practical path to global diversification, allowing investors the opportunity to break free from the constraints of home bias and optimize returns.